Fig. 5
Download original image
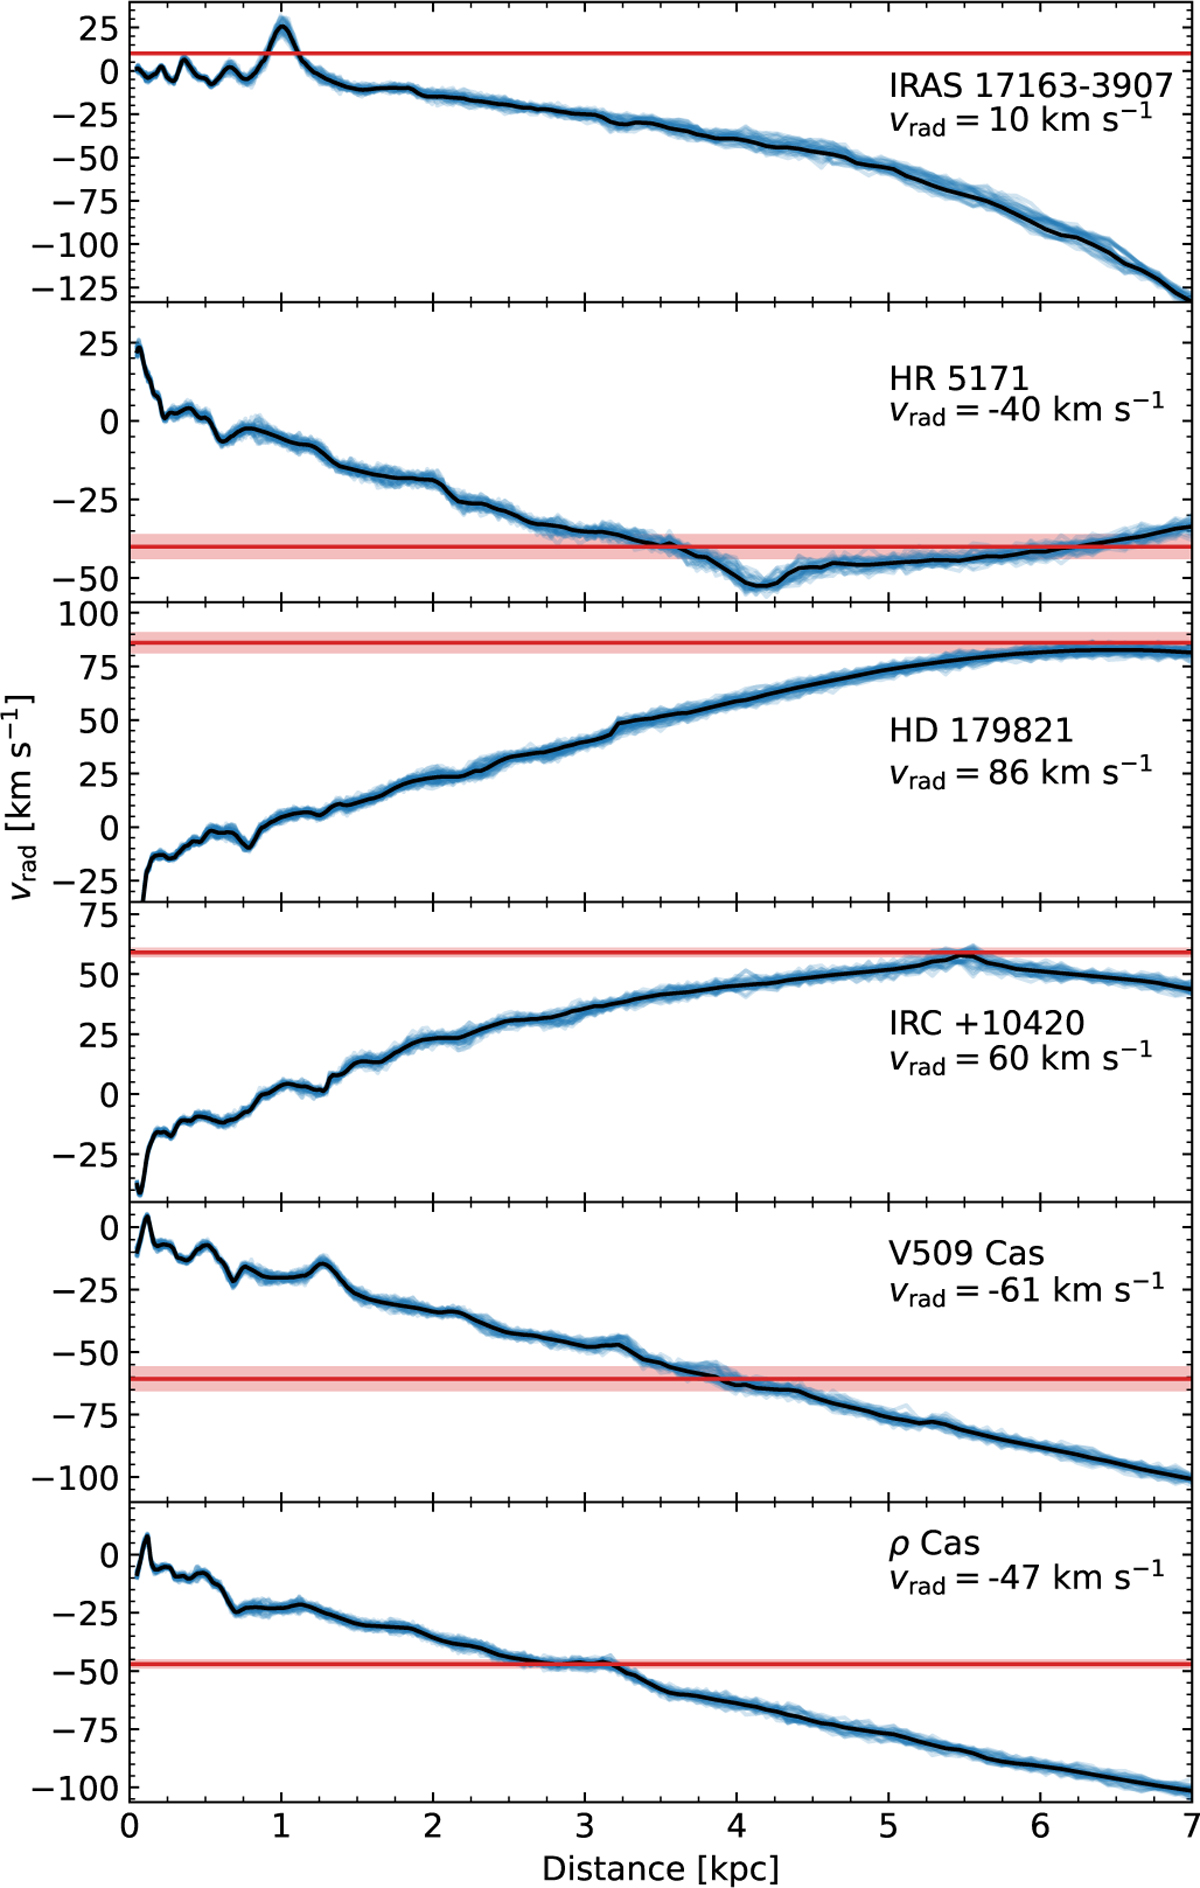
Radial velocity of H I gas along the lines of sight towards six YHGs. The thin blue lines show the sampled posterior velocity distribution of H I at each distance bin within a 0.5 deg region around each star. The solid black line indicates the mean velocity. The horizontal red lines mark the observed stellar radial velocity, and the shaded region shows the approximate variability amplitude.
Current usage metrics show cumulative count of Article Views (full-text article views including HTML views, PDF and ePub downloads, according to the available data) and Abstracts Views on Vision4Press platform.
Data correspond to usage on the plateform after 2015. The current usage metrics is available 48-96 hours after online publication and is updated daily on week days.
Initial download of the metrics may take a while.