| Issue |
A&A
Volume 708, April 2026
|
|
|---|---|---|
| Article Number | A78 | |
| Number of page(s) | 21 | |
| Section | Galactic structure, stellar clusters and populations | |
| DOI | https://doi.org/10.1051/0004-6361/202558527 | |
| Published online | 01 April 2026 | |
Painting a family portrait of the yellow super- and hypergiants in the Milky Way
I. Constraining the distances and luminosities
1
Tartu Observatory, University of Tartu,
Observatooriumi 1,
Tõravere
61602,
Estonia
2
European Southern Observatory,
Alonso de Córdova 3107, Vitacura, Casilla
19001
Santiago de Chile,
Chile
★ Corresponding author: This email address is being protected from spambots. You need JavaScript enabled to view it.
Received:
11
December
2025
Accepted:
2
February
2026
Abstract
Context. The distances to evolved massive stars in the Milky Way are poorly constrained by Gaia parallaxes because these stars are bright and variable. This makes it difficult to determine their fundamental stellar parameters, such as radius or luminosity, and infer their evolutionary states.
Aims. We aim to improve the distance estimates of yellow hypergiants (YHGs) and yellow supergiants (YSGs) by identifying possible cluster and association memberships. Using these distances, we derived updated luminosities and revised their positions in the Hertzsprung-Russell diagram.
Methods. We compiled a sample of 35 luminous yellow massive stars (YHGs and the most luminous YSGs) from the literature. We used Gaia DR3 astrometry to identify possible membership in clusters and OB associations. We derived distances by combining the parallaxes of nearby co-moving stars. We independently validated these distances by comparing the stellar radial velocities to the Galactic H I kinematic map. We combined angular diameters and effective temperature values from the literature with the new distances to estimate the luminosities.
Results. We improved the distance estimates for 28 of the 35 stars through association with co-moving stellar groups. For an additional 6 stars, we provided distance estimates based on the H I kinematic map. For one star, the distance remains unclear. Most YSGs are members of young stellar populations, while the environments of the YHGs are more diverse, and the origin populations for some of them remain unclear. We derived updated luminosities for a subset of 20 stars. Most YHGs have luminosities above log L/L⊙ = 5.4, while YSGs occupy a wider range of luminosities, and the luminosities of the most luminous YSGs are similar to those of YHGs.
Key words: methods: observational / stars: distances / stars: massive / supergiants
© The Authors 2026
 Open Access article, published by EDP Sciences, under the terms of the Creative Commons Attribution License (https://creativecommons.org/licenses/by/4.0), which permits unrestricted use, distribution, and reproduction in any medium, provided the original work is properly cited.
This article is published in open access under the Subscribe to Open model. This email address is being protected from spambots. You need JavaScript enabled to view it. to support open access publication.
1 Introduction
Stellar population studies of young star clusters have revealed numerous massive stars in transitional evolutionary phases (recently, e.g. Marco et al. 2025; Maíz Apellániz & Negueruela 2025). Knowledge of the surrounding stellar population and environment provides context for understanding the evolution of massive stars. Yellow supergiants (YSGs) and the rarer, more elusive yellow hypergiants (YHGs) are unstable and short-lived phases on the cool side of the upper Hertzsprung-Russell (HR) diagram. YHGs are generally considered to represent a more extreme or advanced stage of evolution than typical YSGs and have been proposed as post-red supergiants (post-RSGs; de Jager 1998).
The distinction between YHGs and YSGs is based on their spectroscopic characteristics: YHGs have extended atmospheres, one or more broad Hα emission components, and significantly wider absorption lines than YSGs (de Jager 1998). Beyond using spectroscopic features to distinguish YHGs from YSGs, studies have proposed luminosity thresholds (log L/L⊙ > 5.2; de Jager & Nieuwenhuijzen 1997), a distinct pulsational behaviour and the presence of circumstellar dust (Humphreys et al. 2023), and a high 12CO/13CO isotopic ratio (Oksala et al. 2013). Homogeneously determined observational parameters of YHGs and YSGs provide a basis for comparison with stellar evolutionary models, improving our overall understanding of evolutionary pathways of luminous yellow massive stars and their role as supernova progenitors (e.g. Aldering et al. 1994; Crockett et al. 2008; Maund et al. 2011; Tartaglia et al. 2017; Kilpatrick et al. 2017; Niu et al. 2024; Reguitti et al. 2025).
Extensive work has been done to characterise the luminous cool supergiant populations of the Magellanic Clouds and other nearby galaxies (e.g. Martin & Humphreys 2023; Dorn-Wallenstein et al. 2023; Maravelias et al. 2026). However, in the Milky Way, studies have been hampered by uncertain distances and high extinction in the Galactic plane. In the era of Gaia and due to the efforts by Bailer-Jones et al. (2021), the distance estimates for many stars have improved significantly. For objects that lack reliable Gaia parallaxes, other indirect methods can be used to estimate distances. We combined and compared the results of two complementary methods. The first method is based on an analysis of nearby stars: since many YHGs and YSGs are known or suspected members of stellar clusters or OB associations, confirming these memberships and combining the parallaxes of nearby stars (e.g. Campillay et al. 2019) can help refine their distance estimates. The second method compares the stellar radial velocities with the Galactic H I kinematics. Agreement between these independent methods increases confidence in the derived distances.
In Sect. 2 we give an overview of the selected targets. In Sect. 3 we revisit the cluster and OB association memberships of YHGs and YSGs in the Milky Way and determine the distances to the stellar groups. In Sect. 4, we derive independent distance estimates using the H I kinematic map of the Milky Way. In Sect. 5, we combine our distance measurements with effective temperatures and angular radii from the literature to place the Milky Way YHGs and YSGs on the HR diagram. Finally, in Sect. 6 we discuss the spatial distribution and binary properties of our sample stars.
2 Sample selection
We queried Simbad for YSGs and F and G spectral class stars with luminosity class Ia or Iab with infrared excess (V − K > 3 mag). From the resulting list, we excluded objects that are identified in the literature as luminous post-asymptotic giant branch (post-AGB) stars. We also excluded stars with reliable Gaia DR3 parallaxes that place them closer than expected for luminous YSGs. We added additional luminous YSGs from the literature (de Jager 1998; Mantegazza 1992; Kovtyukh et al. 2012) and included stars that have been proposed as YHG candidates: IRAS 18357-0604 (Clark et al. 2014) and HD 144812 (Kourniotis et al. 2025). The resulting 25 stars form our sample of YSGs.
We also included the well-known YHGs in the Milky Way: V509 Cas, ρ Cas, IRC +10420, HR 5171, 6 Cas, HD 96918, and the yellow-red hypergiant RW Cep (de Jager 1998), IRAS 17163-3907 (Lagadec et al. 2011), HD 179821 (Hawkins et al. 1995), and [FMR2006] 15 (Figer et al. 2006). When we mention YHGs throughout this paper, we refer to the ten stars in this list.
We did not aim for a complete census, but rather for a representative sample of the most luminous YSGs and YHGs. The final sample of 35 objects is presented in Table A.1.
3 Distances based on stellar group identification
Gaia Data Release 3 (DR3; Gaia Collaboration 2016, 2023) has provided proper motion and parallax measurements for ~1.3 billion sources, enabling improved determinations of distances and cluster memberships. However, Gaia parallaxes are subject to systematics and biases. For YHGs and YSGs, the parallax values can have large uncertainties (>20%) and, in some cases, they are even negative. A major source of error is their brightness; approximately half of our sample is brighter than G = 6 mag. Another source of astrometric error for cool massive stars is caused by photocentric variability due to surface convection (Chiavassa et al. 2011; Pasquato et al. 2011; El-Badry 2025). Additionally, some stars have high values of the renormalised unit weight error (ruwe), indicating poor astrometric fits, which may result from an unresolved binary companion (e.g. Castro-Ginard et al. 2024) or circumstellar structure (Fitton et al. 2022).
Bailer-Jones et al. (2021) provided probabilistic distance estimates that take the Galactic structure into account and mitigate the limitations of the simple 1/parallax distance estimate. Although generally more reliable, these distance estimates still require careful interpretation. In several cases, the Bailer-Jones et al. (2021) distances disagree with the values commonly adopted in the literature (see Table A.1). For stars with RUWE< 1.4 and parallax uncertainties better than 20%, the Bailer-Jones et al. (2021) distances are likely to be reliable.
To improve the distances for YHGs and YSGs with poor Gaia parallaxes, we explored their kinematics based on proper motions in the context of their surrounding stellar environments, that is, nearby star clusters, OB associations, and regions hosting young stellar objects (YSOs). We cross-matched several catalogues of open clusters and OB associations with Gaia data. Membership in these co-moving groups implies a common distance.
3.1 Method
To determine possible open cluster memberships, we queried the catalogue of Hunt & Reffert (2024). We counted a YHG or YSG as a member of a cluster when its projected on-sky position was within the cluster boundaries and its proper motion was within 3σ of the cluster mean proper motion. When reliable parallaxes were available, we also used them to confirm membership. We verified whether the stars are members of any known OB associations listed by Mel’nik & Dambis (2017). We compared the proper motions of the YHGs and YSGs with members of the OB associations in the catalogue by Chemel et al. (2022) to infer a possible affiliation. OB associations extend farther than clusters in the area projected on sky and are less tightly connected in proper motion space. We counted a YHG or YSG as affiliated with an OB association when at least two association members were located within a radius of 1 deg on the sky and within a radius of 0.5 mas yr−1 in proper motion space. In most cases, significantly more stars had a similar proper motion in the same sky region. We list possible cluster and OB association memberships in the column “Identified cl/assoc” of Table A.1. Detailed notes for all individual stars are provided in Appendix B.
To estimate the group-based distance for each target, we identified stars with high-quality astrometric data belonging to the same population. Proper motions and positions are not enough to distinguish between stellar populations, and another criterion is therefore needed (e.g. colour index was used by Negueruela et al. 2022). We used the effective temperature Teff from Gaia GSP-Phot as an additional criterion. Since we searched for co-located and co-moving populations associated with young clusters or OB associations, we limited our search to B-type and early A-type stars with effective temperatures 8 700K < Teff < 18 000K. This approach assumes that YSGs or YHGs are still physically associated with their birth environments. When the star has migrated or has been ejected from its birth environment, we might not be able to identify a co-moving group, and this method becomes unreliable. We followed the method given by Campillay et al. (2019) and Maíz Apellániz et al. (2021a,b).
We identified hot stars belonging to the neighbourhood of each YHG and YSG, combined their parallaxes, and estimated the distance to the stellar group following these steps:
Select hot stars with high-quality astrometry within 10′ of the target, applying the following selection criteria: good astrometry (RUWE< 1.4); bright sources (G < 18 mag); reliable parallaxes (parallax/error > 5); five-parameter astrometric solution (ASTROMETRIC_PARAMS_SOLVED=31).
Correct the Gaia proper motions for known biases affecting bright targets following the method of Cantat-Gaudin & Brandt (2021).
Apply a proper motion cut to separate stars with similar kinematics.
Correct the parallaxes for Gaia zero-point offsets (Lindegren et al. 2021a)1.
Calculate the group parallax by combining the individual parallaxes and errors following the recipe given in Campillay et al. (2019), considering the external parallax uncertainty (Fabricius et al. 2021) and the angular covariance term. The systematic parallax uncertainty gives a minimum distance uncertainty of ~d% for a star at d kpc (Maíz Apellániz et al. 2021b).
Convert the group parallax into a geometric distance using the generalized gamma distribution (GGD) prior of Bailer-Jones et al. (2021)2.
The range of the proper motion cut is flexible and depends on the stellar environment of each YSG in our sample. By exploring the scatter of proper motions of stars recognised as members of a single cluster in the catalogue of Hunt & Reffert (2024), we found that cluster stars typically have a dispersion in proper motion of ~0.2–0.3 mas yr−1. In contrast, stars in OB associations in the catalogues of Chemel et al. (2022) and Mel’nik & Dambis (2017) are less strongly bound, showing a proper motion dispersion of ~1–2 mas yr−1 (Fig. 1). Thus, depending on the stellar environments surrounding each target, the cut radius varied from 0.1 to 1.5 mas yr−1.
A YHG or YSG might still belong to a stellar group even when no nearby co-moving stars are identified in our search. We estimated the limiting distance at which hot stars would still fall within our criteria. As a representative case, we considered a B3 main-sequence star with Teff = 17 000 K and an absolute G-band magnitude MG = −1.19 mag3. We adopted an average visual extinction in the Galactic disc of AG ~ 1 mag kpc−1. The extinction value varies strongly with direction and the local extinction law: in the solar neighbourhood, AV ~ 1 mag kpc−1 and 0.80 ≤ AG/AV ≤ 0.89 for 2 ≤ RV ≤ 4 (Gontcharov et al. 2023). The average extinction of open clusters in the Galactic disc is AV = 0.70 mag kpc−1 (Froebrich et al. 2010), but the extinction can be as low as AV = 0.37 mag kpc−1 in diffuse regions (Wang et al. 2017) or higher in specific directions, for example AV = 1.45 mag kpc−1 for open cluster King 7 (Straižys et al. 2021). We adopted an upper magnitude limit of G = 18 mag because fainter stars are unlikely to have reliable parallaxes. From the absolute magnitude equation G = MG + 5 log d − 5 + AG, where d is distance in parsecs, we find that a B3 star has an apparent G-band magnitude of 9.8 mag at 1000 pc, 14.2 mag at 3000 pc, and 15.8 mag at 4000 pc. At the cooler end of our hot-star selection, an A2 main-sequence star with Teff = 8 800 K and absolute magnitude MG = 1.35 mag would appear at G-band magnitudes of 12.3 mag at 1000 pc, 16.7 mag at 3000 pc, and 18.4 mag at 4000 pc. Because the hotter end of the temperature range contains fewer stars, this method is generally able to detect stellar populations out to distances of 3000–4000 pc.
3.2 Example
As an illustrative example, we applied this method to the YHG 6 Cas. A previous study by Maíz Apellániz et al. (2021a) identified three nearby stars with reliable Gaia DR2 astrometry and derived a distance of ![Mathematical equation: $\[2780_{-290}^{+370}\]$](/articles/aa/full_html/2026/04/aa58527-25/aa58527-25-eq1.png) pc by combining their parallaxes. Figure 1 shows the sky region surrounding 6 Cas, including the positions and proper motions of nearby stars, clusters, and OB associations. 6 Cas has a similar proper motion as three clusters and OB associations Cas OB5 (Mel’nik & Dambis 2017) and no. 141 (Chemel et al. 2022).
pc by combining their parallaxes. Figure 1 shows the sky region surrounding 6 Cas, including the positions and proper motions of nearby stars, clusters, and OB associations. 6 Cas has a similar proper motion as three clusters and OB associations Cas OB5 (Mel’nik & Dambis 2017) and no. 141 (Chemel et al. 2022).
We selected stars from Gaia DR3 within a 10’ on-sky radius of 6 Cas following the criteria listed above. The temperature criterion is informative. Figure 2 shows the distances from (Bailer-Jones et al. 2021) plotted against Gaia effective temperatures for hot stars within 10′ of 6 Cas. Stars with lower temperatures have a large scatter in distance, while stars hotter than 10 000 K seem to form a plateau just below 3000 pc.
After correcting for the proper motion bias, we selected stars with proper motions similar to that of 6 Cas, that is, stars with proper motions within 0.2 mas yr−1 of its value (see Fig. 3). Applying the proper motion cut resulted in 38 stars.
We discarded any obvious outliers and stars whose parallaxes deviated by more than 2σ (≳0.1 mas) from the sample mean value, resulting in a final selection of 31 stars. These stars are marked with black crosses in Figs. 2 and 3. Their consistent distances suggest that they belong to a common association-like environment. A YHG or YSG that is no longer associated with its birth environment would not show this tight distance grouping.
We corrected the parallaxes of the final sample for the Gaia zero-point offset (Lindegren et al. 2021b). These offsets are small (~0.02–0.04 mas). We combined the parallaxes following the recipe of Maíz Apellániz et al. (2021b). The resulting mean parallax for 6 Cas is ϖ = 0.3586 ± 0.0088. We derived a geometric distance for 6 Cas of ![Mathematical equation: $\[2790_{-71}^{+70}\]$](/articles/aa/full_html/2026/04/aa58527-25/aa58527-25-eq2.png) pc, where the errors correspond to the 68% confidence interval. This result agrees well with the previous estimate of
pc, where the errors correspond to the 68% confidence interval. This result agrees well with the previous estimate of ![Mathematical equation: $\[2780_{-290}^{+370}\]$](/articles/aa/full_html/2026/04/aa58527-25/aa58527-25-eq3.png) pc by Maíz Apellániz et al. (2021a).
pc by Maíz Apellániz et al. (2021a).
Given the similarity in proper motion and spatial proximity to Cas OB 5, located at a distance of 2500–3000 pc (Quintana et al. 2025), we support the conclusion of Mel’nik & Dambis (2017) that 6 Cas is likely a member of this association. For the same reasons, 6 Cas might belong to association no. 141 identified by Chemel et al. (2022) at a distance of 2827 pc. The proper motion, on-sky location, and distance of Cas OB5 members identified by Mel’nik & Dambis (2017) largely overlap with stars in association no. 141 from Chemel et al. (2022), suggesting that they are the same stellar group (see Fig. 1).
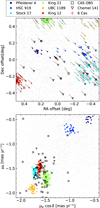 |
Fig. 1 Sky region around 6 Cas (red cross). Top panel: projected offsets on sky. Bottom panel: proper motions. Field stars from Gaia are marked in grey (one in ten is plotted), open clusters from Hunt & Reffert (2024) are marked in coloured points, members of the OB associations Cas OB5 from Mel’nik & Dambis (2017) and no. 141 (Chemel et al. 2022) are marked with open symbols (some members overlap between the two catalogues). The arrows in the top panel indicate the motion of cluster and OB association stars over the past 0.1 Myr based on their proper motions. |
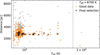 |
Fig. 2 Gaia effective temperatures and Bailer-Jones et al. (2021) distances for hot stars within 10′ of 6 Cas. Stars meeting our astrometric quality criteria are highlighted in orange. The final selection of stars used for the distance estimation is marked with black crosses. |
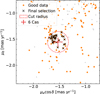 |
Fig. 3 Selection of stars near 6 Cas (red cross) based on proper motion, using the same sample as in Fig. 2. The proper motion cut with a radius of 0.2 mas yr−1 is marked with a red circle. |
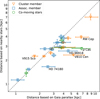 |
Fig. 4 Comparison of group-based distances derived in this work with distances derived from Gaia parallaxes by Bailer-Jones et al. (2021). Stars associated with clusters, OB association, and stars without an origin group are marked with different symbols and colours. The dashed grey line marks the one-to-one relation. Outliers are marked. Both axes are logarithmic. |
3.3 Results
The group-based distances derived in this work are listed in Table A.1. The proper motion cuts are illustrated in Appendix C, and the stars used for combining the parallaxes are listed in Appendix D, with a full table available at the CDS.
Figure 4 compares our group-based distances for the YHG or YSG sample with those listed in the Bailer-Jones et al. (2021) catalogue. We used the RGEO values from that catalogue, as the RPGEO distances that consider the photometric colour indices are unlikely to reliably characterise supergiants. For stars with relatively small parallax errors, our results agree well with the Bailer-Jones et al. (2021) catalogue values. We found significant differences for stars that have very large parallax errors, where the Bailer-Jones et al. (2021) distances tend to be very large, above 4000 pc. We found that they are likely much closer, because we identified possible affiliations with clusters or OB associations at distances of 2000–3000 pc.
Overall, we improved the distance estimates for 28 stars out of the 35 stars in our sample. Eleven of these 28 stars are cluster members, 13 are in OB associations, and 4 stars do not belong to a stellar group, but we found a co-moving population. For the remaining 7 stars, we were unable to determine a group-based distance. IRAS 17163-3907, HD 179821, IRC+10420, V870 Sco, and IRAS 14394-6059 have co-moving stars spanning distances from 1000 pc to 4000 pc, but no clearly identifiable origin group. Most of these stars are also too distant or too reddened for this method. The final two stars, [FMR2006] 15 and IRAS 18357-0604, belong to a distant (~6000 pc) stellar population rich in RSGs. We were unable to obtain group-based distances for them because of their large distance and high extinction.
4 Kinematic distances from the Galactic H I map
To independently verify the group-based distances derived in Sect. 3, we compared the stellar radial velocities of our targets with the kinematics of H I gas in the Milky Way. The H I gas traces the small- and large-scale structures in the Galaxy (McClure-Griffiths et al. 2023, and references therein). When a star is affiliated with a cluster or an OB association, which generally move together with the Galactic rotation and the surrounding interstellar medium (e.g. Castro-Ginard et al. 2021), its group-based distance should be consistent with the distance inferred from the kinematics of the surrounding H I gas. The radial velocities of supergiants and stars younger than 108 yr are correlated with the H I gas velocity (Fletcher 1963; Humphreys 1970).
4.1 Method
We used the spatially coherent 3D kinematic map of the H I gas in the Milky Way by Söding et al. (2025), based on 21 cm emission measurements from the HI4PI survey (Bekhti et al. 2016). The format of the map was the Hierarchical Equal Area isoLatitude Pixelation of a sphere (HEALPix). It includes eight posterior samples for each point in the Sun-centred HEALPix-times-distance grid. We used the auxiliary fields data product by Söding et al. (2024), which includes the three components of the Galactic velocity field in each grid point. The velocity field was heliocentric and corrected for the peculiar motion of the Sun. The bin size increased from ~30 pc at a distance of 2000 pc to a distance of ~100 pc at 5000 pc.
For each star in our sample, we extracted the line-of-sight radial velocity of the H I gas within a radius of ~0.5 deg and plotted its value as a function of distance. We compared these gas velocity profiles with the stellar systemic radial velocity to determine the distance at which the two values were equal. We used systemic radial velocities from monitoring studies or mean radial velocities and variability amplitudes from Gaia DR3, where the former were not available. The adopted stellar radial velocities are listed in Table E.1. The radial velocity variability of YHGs makes it difficult to determine accurate systemic velocities, and the gas velocity map provides accuracy at scales of hundreds of parsecs (Söding et al. 2025). Therefore, the resulting distances have uncertainties of ~500 pc.
4.2 Examples
The gas velocity profiles and vrad for six well-known YHGs are shown in Fig. 5. Depending on the shape of the H I velocity curve in the line of sight towards each star, we obtained either a single distance estimate when the stellar systemic velocity equaled the gas velocity at a specific distance (e.g. V509 Cas), or a distance range when the shape of the H I velocity curve was flat over a distance span (e.g. ρ Cas). We highlight a few YHGs that are located in different Galactic lines of sight.
IRAS 17163-3907. The radial velocity of IRAS 17163-3907 with respect to the local standard of rest (LSR) is 18 km s−1 (Wallström et al. 2015). Transformation to the heliocentric reference frame results in a radial velocity of 9.7 km s−1, which is compatible with the H I gas velocity near 1000 pc. We were unable to constrain a group-based distance. The H I-based distance agrees well with the ![Mathematical equation: $\[1200_{-200}^{+400}\]$](/articles/aa/full_html/2026/04/aa58527-25/aa58527-25-eq4.png) pc distance estimate from the Gaia DR2 parallax (Koumpia et al. 2020) and from spectrophotometric analysis (Wallström et al. 2015). It differs significantly from the 3600–4700 pc range proposed by Lagadec et al. (2011) and from the distance derived from the Gaia DR3 parallax (
pc distance estimate from the Gaia DR2 parallax (Koumpia et al. 2020) and from spectrophotometric analysis (Wallström et al. 2015). It differs significantly from the 3600–4700 pc range proposed by Lagadec et al. (2011) and from the distance derived from the Gaia DR3 parallax (![Mathematical equation: $\[5196_{-1032}^{+1401}\]$](/articles/aa/full_html/2026/04/aa58527-25/aa58527-25-eq5.png) pc; Bailer-Jones et al. 2021). Our result supports a shorter distance of ~1000 pc for IRAS 17163-3907.
pc; Bailer-Jones et al. 2021). Our result supports a shorter distance of ~1000 pc for IRAS 17163-3907.
HR 5171. The radial velocity of HR 5171 has been extensively monitored, with mean values of −40 km s−1 (Humphreys et al. 1971) and −38 km s−1 with a variability amplitude of 3.5 km s−1 (Balona 1982). This velocity corresponds to H I gas at a distance of 3500 pc, similar to the group-based distance of ![Mathematical equation: $\[2953_{-96}^{+92}\]$](/articles/aa/full_html/2026/04/aa58527-25/aa58527-25-eq6.png) pc within errors. The H I-based distance is also consistent with the established distance of 3600 pc (Humphreys et al. 1971; Chesneau et al. 2014) and with the distance from the Gaia parallax of
pc within errors. The H I-based distance is also consistent with the established distance of 3600 pc (Humphreys et al. 1971; Chesneau et al. 2014) and with the distance from the Gaia parallax of ![Mathematical equation: $\[3601_{-539}^{+649}\]$](/articles/aa/full_html/2026/04/aa58527-25/aa58527-25-eq7.png) pc (Bailer-Jones et al. 2021), and it does not support the 1500 ± 500 pc distance suggested by van Genderen et al. (2019). For HR 5171, a more distant distance solution at ~6000 pc is also possible. Such a distance ambiguity is possible for objects located in the inner Galaxy inside the solar orbit (Nakanishi & Sofue 2003). In these cases, the alternative solution is generally very small (<1000 pc) or very large (>5000 pc) and unlikely for most targets. We do not list them in Table A.1. Our results confirm the distance of HR 5171 at 2900–3500 pc.
pc (Bailer-Jones et al. 2021), and it does not support the 1500 ± 500 pc distance suggested by van Genderen et al. (2019). For HR 5171, a more distant distance solution at ~6000 pc is also possible. Such a distance ambiguity is possible for objects located in the inner Galaxy inside the solar orbit (Nakanishi & Sofue 2003). In these cases, the alternative solution is generally very small (<1000 pc) or very large (>5000 pc) and unlikely for most targets. We do not list them in Table A.1. Our results confirm the distance of HR 5171 at 2900–3500 pc.
HD 179821. The high radial velocity of HD 179821 at 86 km s−1 (Şahin et al. 2016) agrees well with the gas velocity only at large distances (>5000 pc), providing a lower distance limit. We were unable to constrain a group-based distance. Literature values vary from 1000 pc (Josselin & Lèbre 2001) to 6000 pc (van Genderen et al. 2019). The Gaia DR3 parallax is reliable, with an error of ~10% and a RUWE value of 0.92, corresponding to a distance of ![Mathematical equation: $\[4432_{-355}^{+349}\]$](/articles/aa/full_html/2026/04/aa58527-25/aa58527-25-eq8.png) pc (Bailer-Jones et al. 2021), which is in acceptable agreement with our result. We adopted the Gaia distance for this star.
pc (Bailer-Jones et al. 2021), which is in acceptable agreement with our result. We adopted the Gaia distance for this star.
IRC +10420. The radial velocity measured from emission lines in IRC + 10420 is between 60 and 68 km s−1 (Klochkova et al. 1997; Humphreys et al. 2002), consistent with the result of CO rotational lines of vLSR 75 km s−1 (LSR correction ~16 km s−1; Oudmaijer 1998). This velocity suggests a very large distance of 5500 pc. We were unable to constrain a group-based distance. The large distance is consistent with earlier estimates of 5800 pc (Nedoluha & Bowers 1992) and 4000–6000 pc (Jones et al. 1993) derived from Galactic rotation models. Our result is ~1000 pc greater than the distance derived from the Gaia parallax (![Mathematical equation: $\[4260_{-752}^{+878}\]$](/articles/aa/full_html/2026/04/aa58527-25/aa58527-25-eq9.png) pc). We adopted the Gaia distance for this star.
pc). We adopted the Gaia distance for this star.
V509 Cas. The star has a systemic velocity of −60.7 km s−1 (Kasikov et al. 2024), corresponding to a H I-based distance of ~3800 pc. This agrees with the group-based distance of 3368 ± 127 pc within the errors. This result is significantly different from 1370 ± 480 pc based on the parallax measured by the HIPPARCOS satellite and commonly used for this star (Nieuwenhuijzen et al. 2012; van Genderen et al. 2019), but in good agreement with a distance of ![Mathematical equation: $\[3917_{-737}^{+969}\]$](/articles/aa/full_html/2026/04/aa58527-25/aa58527-25-eq10.png) pc based on its Gaia parallax (Bailer-Jones et al. 2021). Thus, we adopted the group-based distance.
pc based on its Gaia parallax (Bailer-Jones et al. 2021). Thus, we adopted the group-based distance.
ρ Cas. The long-term radial velocity monitoring of ρ Cas gives a well-constrained systemic velocity of −47 ± 2 km s−1 (Lobel et al. 2003). This matches the H I velocity at a distance between 2500 pc and 3200 pc, which agrees well with our estimated group-based distance of ![Mathematical equation: $\[2810_{-102}^{+104}\]$](/articles/aa/full_html/2026/04/aa58527-25/aa58527-25-eq11.png) pc and the 2500 ± 500 pc distance from van Genderen et al. (2019). Thus, we adopted the group-based distance.
pc and the 2500 ± 500 pc distance from van Genderen et al. (2019). Thus, we adopted the group-based distance.
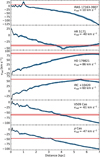 |
Fig. 5 Radial velocity of H I gas along the lines of sight towards six YHGs. The thin blue lines show the sampled posterior velocity distribution of H I at each distance bin within a 0.5 deg region around each star. The solid black line indicates the mean velocity. The horizontal red lines mark the observed stellar radial velocity, and the shaded region shows the approximate variability amplitude. |
4.3 Results and comparison with group-based distances
The H I-based distance results are listed in Table A.1. We derived H I-based distances for 32 stars, 6 of which lack a group-based distance estimate due to a large distance and high extinction. For 3 stars, no systemic radial velocities were available. One target, IRAS 14394-6059, lacks both types of distance estimates, but the Gaia parallax places the star beyond 5000 pc, making it a potentially luminous YSG.
Six stars have only H I-based distances. Three of them, IRC + 10420, HD 179821, and IRAS 17163-3907, were included in the examples above. The other three stars are [FMR2006] 15, IRAS 18357-0604, and V870 Sco. In general, the H I-based distances agree with the distances derived from the Galactic rotation. Information for all stars is included in Appendix B.
Generally, the results of H I-based distances coincide well with the group-based distances within uncertainties of about 500 pc (see Fig. 6). For the group-based distances, the uncertainties are about 100 pc for most stars. Group-based distances are most reliable when a proper motion alignment with a cluster or OB association can be established. Otherwise, there remains a higher probability that stars with similar proper motions do not represent the birth environment. Coincidental proper motion alignment between a YHG or YSG and an unrelated OB association or open cluster at a different distance is possible. This problem becomes more severe towards the Galactic centre, where multiple stellar populations lie along the same line of sight, complicating the identification of a possible origin population and preventing reliable distance determination for several stars. Differences between the H I-based and group-based distances can indicate an incorrect origin group association or help identify potential runaway stars. Of the 26 stars that have both distance estimates, 23 stars have good agreement between the results. For three stars (ϕ Cas, HD 10494, and HD 96918), we found significant discrepancies that we detail below.
ϕ Cas and HD 10494. The two stars have similar radial velocities and lie within a distance of 5 deg from each other on the sky, which corresponds to a physical separation of 270 pc using their group-based distances. The group-based distances of both stars are close to 2800 pc and are based on alignment with young clusters. For HD 10494, the group-based distance also agrees well with the distance derived from the Gaia DR3 parallax, while the parallax of ϕ Cas is unreliable. The radial velocities of ϕ Cas (−28 km s−1) and HD 10494 (around −30 km s−1) are very similar to their home clusters NGC 457 and NGC 654 with vrad ~ −34 km s−1 (Rastorguev et al. 1999). The radial velocities differ from the H I velocity at 2800 pc by 15–20 km s−1 and correspond to H I-based distances in the range of 1000–1800 pc. This discrepancy between H I-based and group-based distances could be a local phenomenon. These clusters are located in the Perseus arm of the Milky Way, in a region with many other young clusters. They are potential members of the Cassiopeia-Perseus open cluster complex, sharing a common origin in the same giant molecular cloud (de la Fuente Marcos & de la Fuente Marcos 2009). If this is the case, the shocks from supernovae from the previous generation of stars might have affected the kinematics of stellar populations in the region.
HD 96918. Comparison of its radial velocity with the H I velocity map implies a distance of ~500 pc or of ~5000 pc. The field around HD 96918 contains many stellar groups spanning from 500 pc to 4000 pc, and aligning it with the kinematically closest OB association results in a distance of 2600 pc. Achmad et al. (1992) found the same distance ambiguity: a Galactic rotation curve (500 pc or 5300 pc) and an interstellar reddening in the line of sight (2400 ± 900 pc), and they compared the derived atmospheric parameters to evolutionary models (2200 pc). Our group-based distance result agrees with the latter two of their estimates. However, this discrepancy raises the possibility that the star is a runaway. We discuss this further in Sect. 6.2.
In the following sections, we used group-based distances when available. Otherwise, if Gaia ϖ/σϖ > 5, we adopted the distances from Bailer-Jones et al. (2021). When neither of these are reliable, we used the H I-based distance.
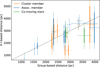 |
Fig. 6 Comparison of group-based and H I-based distances. The solid lines indicate the H I-based distance ranges, and the lighter lines illustrate the uncertainties. Affiliations with stellar groups are indicated with different colours as in Fig. 4. The dashed grey line marks the one-to-one relation. |
5 Radius and luminosity
Based on our distance estimates, we determined the radii and luminosities for 15 YSGs and five YHGs in our sample. In this analysis, we only included stars with available homogeneous angular diameter measurements and adopted literature Teff values.
For stars with multiple published Teff values, we adopted an average temperature, and for stars without spectroscopic temperature estimates, we adopted the temperature closest to their spectral type classification. Due to the inhomogeneous data and discrepancies resulting from different methods, we estimated typical temperature uncertainties of at least 200 K. For stars with multiple published Teff measurements, we adopted uncertainties to encompass the range of published values. The effective temperatures of YHGs can be highly variable. In their quiescent state, they exhibit quasi-periodic pulsations with cycles of a few hundred days, with Teff variability of some hundred degrees (e.g. Kasikov et al. 2024; van Genderen et al. 2025). Temperature changes of 1000–3000 K have been observed during outbursts and on longer timescales (Lobel et al. 2003; de Jager & Nieuwenhuijzen 1997; Klochkova et al. 1997). Several YHGs, such as ρ Cas, V509 Cas, and IRC + 10420, have been photometrically stable for the past decade or more, and their temperatures have been determined during these quiescent phases (van Genderen et al. 2025; Nieuwenhuijzen et al. 2012; Koumpia et al. 2022). For the comparatively normal YSGs, the effective temperatures can differ by several hundred degrees, depending on the methods used.
5.1 Radius
To estimate the stellar radii, we used the limb-darkened angular diameter values from the JMMC Stellar Diameter Catalog (JSDC; Chelli et al. 2016; Bourgés et al. 2014; Bourges et al. 2017). Twenty of the 35 stars in our sample are included in the JSDC catalogue, providing a homogeneous set of angular diameters based on optical and near-infrared colour indices. Of these, 19 have group-based distance values. HD 179821 does not have a group-based distance, but has a relatively good Gaia parallax and distance from Bailer-Jones et al. (2021). Using these distances, we calculated the stellar radii (R/R⊙ = 0.1075 θ d, where θ is the angular diameter in milliarcseconds and d is the distance in parsecs). The results are listed in Table F.1.
Figure 7 shows the derived radii as a function of effective temperature Teff with lines of constant luminosity based on the Stefan-Boltzmann law, ![Mathematical equation: $\[L \propto R^{2} T_{\text {eff}}^{4}\]$](/articles/aa/full_html/2026/04/aa58527-25/aa58527-25-eq12.png) . The radii of YSGs in our sample range from 100 R⊙ to 400 R⊙ with uncertainties around 10%. The radius increases with decreasing effective temperature for stars with similar luminosity. However, the most luminous YHGs, V509 Cas and ρ Cas, appear to have exceptionally large radii of ~600 R⊙. To understand this result, we compared the JSDC angular diameter values with angular diameters derived from interferometric measurements.
. The radii of YSGs in our sample range from 100 R⊙ to 400 R⊙ with uncertainties around 10%. The radius increases with decreasing effective temperature for stars with similar luminosity. However, the most luminous YHGs, V509 Cas and ρ Cas, appear to have exceptionally large radii of ~600 R⊙. To understand this result, we compared the JSDC angular diameter values with angular diameters derived from interferometric measurements.
For V509 Cas, the JSDC lists an angular diameter of 1.57 ± 0.12 mas, while the diameter measured by van Belle et al. (2009) is smaller by about 20%, 1.24 ± 0.03 mas. The calculated radii are 567 ± 111 R⊙ and 449 ± 20 R⊙, respectively. The latter value is similar to ~400 R⊙ found by Nieuwenhuijzen et al. (2012). For ρ Cas, the JSDC angular diameter is 2.16 ± 0.19 mas, while Anugu et al. (2024) determined an angular limb-darkened diameter of 2.09 ± 0.02 mas from near-infrared interferometry. At our group-based distance, the resulting radii are 633 ± 62 R⊙ and 609 ± 27 R⊙, respectively. van Genderen et al. (2025) determined the radius of ρ Cas from its pulsational cycle and found a quiescent radius of ~400 R⊙ and an outburst radius of >700 R⊙ at a distance of 2500 pc (~450 R⊙ and ~780 R⊙ at our group-based distance of 2800 pc). Since the last outburst in 2013, ρ Cas has been quiescent (van Genderen et al. 2025). There is a considerable discrepancy between the radii derived from interferometric and pulsational studies.
The heterogeneous interferometric studies available for a small number of YSGs and YHGs do not allow us to consistently quantify any systematic offset between the JSDC-inferred angular diameters and those obtained from interferometric measurements. However, comparison with literature values obtained through different methods suggests that the JSDC angular diameters for V509 Cas and ρ Cas are likely overestimated. The JSDC empirical relations between angular diameters and photometric indices for luminosity classes I, II, and III are primarily calibrated on K- and M-type giants, with very few hotter stars included (Chelli et al. 2016). For luminous supergiants in advanced evolutionary states, these relations may not apply. In addition, the colours of YHGs are intrinsically variable (van Genderen et al. 2019), which may contribute to the uncertainty in determining diameters from photometric indices. With limited and heterogeneous interferometric measurements available, we cannot establish systematic offsets between angular diameters from the JDSC and those obtained from interferometric measurements. Homogeneously derived angular diameters from the spectral energy distribution or interferometric modelling are required to obtain self-consistent radii for the sample stars.
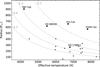 |
Fig. 7 Stellar radii vs. Teff. The YHGs are labelled, and dashed grey lines indicate constant-luminosity tracks at the indicated log L/L⊙ values (50 000, 100 000, 200 000, and 500 000 L⊙.) |
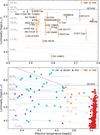 |
Fig. 8 Yellow hypergiants and YSGs on the HR diagram. YHGs are shown as filled yellow circles, and YSGs and candidate YHGs are shown as empty yellow circles. Literature values for four YHGs are shown as grey circles. The HD luminosity limit (Humphreys 1978) is marked with a dashed line. Solar metallicity evolutionary tracks (Ekström et al. 2012) are shown as dotted light grey lines. Top panel: yellow hypergiants and YSGs only. Bottom panel: literature data for Galactic RSGs (red squares; Healy et al. 2024), LBVs (cyan diamonds; Smith et al. 2019), and B[e] Supergiant stars (blue triangles; Miroshnichenko et al. 2025) are shown for comparison. |
5.2 Luminosity
Using the stellar radii derived for 20 stars in the previous section, we estimated the stellar luminosities using the Stefan-Boltzmann law. The resulting luminosities are listed in Table F.1, together with literature values for comparison. For studies reporting bolometric magnitudes, we converted them into luminosity using log L/L⊙ = 0.4 (−Mbol + 4.74; Mamajek et al. 2015).
The luminosities of YSGs and YHGs are shown in the top panel of Fig. 8. For V509 Cas and ρ Cas, we used the radii from Nieuwenhuijzen et al. (2012) and van Genderen et al. (2025) instead of the JSDC values to avoid overestimated angular diameters. No angular diameters are listed in the JDSC for IRC+10420, IRAS 17163-3907, [FMR2006] 15, and HR 5171, but we adopted their luminosities from the literature for reference. The bottom panel of Fig. 8 shows the high-luminosity region of the HR diagram, including the B[e] supergiants (B[e]SGs), luminous blue variables (LBVs), and RSGs. The LBV and B[e]SG luminosities have significant error bars, which are not displayed for clarity.
In the HR diagram, most YHGs occupy the region above log L/L⊙ > 5.4, which corresponds to Mini = 25–40 M⊙. Three stars lie near the Humphreys-Davidson (HD) luminosity limit: IRC+10420, IRAS 17163-3907, and V509 Cas. The YSGs occupy a wider range of luminosities, with the most luminous YSGs partially overlapping with the less luminous YHGs. The luminosities of three YHGs, HD 179821, RW Cep, and HD 96918, agree well with previous studies. Significant deviations are found for V509 Cas and ρ Cas, where using the angular diameters from JDSC results in unexpectedly large radii and unreasonably high luminosities (log L/L⊙ > 5.8), although the large radius for ρ Cas is supported by an interferometric study (Anugu et al. 2024). The calculated luminosities for YSGs agree very well in general with literature values. We only found a discrepancy for V810 Cen, where the previous luminosity estimate of log L/L⊙ = 5.3 (Kienzle et al. 1998) is much higher than our value of log L/L⊙ = ![Mathematical equation: $\[4.74_{-0.11}^{+0.09}\]$](/articles/aa/full_html/2026/04/aa58527-25/aa58527-25-eq13.png) due to a revised distance that is lower by ~1000 pc.
due to a revised distance that is lower by ~1000 pc.
6 Discussion
6.1 Spatial distribution
Following discussions of the spatial distribution and possible isolation of LBVs and supergiants with the B[e] phenomenon, (e.g. Smith & Tombleson 2015; Aadland et al. 2018; Deman & Oey 2024; Martin et al. 2025, and references therein), van Genderen et al. (2019) proposed that the YHGs ρ Cas, V509 Cas, HR 5171, and HD 179821 are isolated objects. This might be evidence of an evolutionary connection with LBVs. An explanation for the potential isolation of LBVs is their origin through binary evolution, either as a merger product or as a mass gainer in Roche-lobe overflow systems that were kicked out of their original population after their companion exploded as a stripped-envelope supernova Smith & Tombleson (2015).
Figure 9 shows the locations of our sample stars projected on a schematic view of the Milky Way. We used the group-based distances where available, and otherwise, the H I-based or Bailer-Jones et al. (2021) distances. The stars broadly trace the spiral arms of the Galaxy. Our results indicate that YHGs are located in heterogeneous environments. Two YHGs are likely cluster members, three are in OB associations, and one is in a star-forming region. Four YHGs may not be affiliated to stellar groups, but two of them are too far away for us to draw a clear conclusion.
In contrast, a majority of the YSGs in our sample are associated with stellar groups. The kinematic properties of 20 out of 25 YSGs are consistent with membership in open clusters or OB associations. For 5 stars, no clear origin group could be found. In two of these cases, V870 Sco and IRAS 14394-6059, the stars are distant and have high extinction. For the other three stars, HD 12399, o1 Cen, and HD 144812, we can identify co-moving stars at a similar distance.
Overall, we found that most YSGs are members of young stellar populations. This is consistent with YSGs being younger pre-RSG objects and still affiliated to their birth environments. The environments of the YHGs are more diverse, and for almost half of them, their origin populations remain unclear. This might be the result of different evolutionary histories. If this is the case, there may be multiple ways for a star to become a YHG, and the distance from their birth environments may be a result of binary interactions.
The number of luminous YSGs found in the Large Magellanic Cloud (Martin & Humphreys 2023) is more than double the size of our sample and could provide more insight into their surrounding environments. Improved astrometry and distances of Galactic YSGs and YHGs will be provided by the Gaia DR4 release5, which will include epoch astrometry for all sources.
 |
Fig. 9 Family portrait. Illustration of the Milky Way4 showing the distribution of YSGs (circles) and YHGs (stars). Objects with group-based distances are marked with filled markers, and objects with distances based on H I or Bailer-Jones et al. (2021) are marked with empty markers. |
6.2 Runaway stars
About 25–30% of the Galactic O-type stars are runaway stars, and about a quarter of them show bow shocks generated from the interaction between their stellar winds and the interstellar medium (Carretero-Castrillo et al. 2023, 2025). Studies in the SMC suggested that about 65% of the OB-type field stars are runaways, mainly due to dynamical ejections from clusters (Dorigo Jones et al. 2020, and references therein). Since OB stars are the progenitors of YHGs or YSGs, some stars in our sample might have experienced an ejection event. The YHGs in our sample without a clear group affiliation have variable stellar winds and have undergone major mass-loss events (e.g. Lobel et al. 2003; Oudmaijer 1998; Koumpia et al. 2020; Jura & Werner 1999), setting ideal conditions for bow shock formation in a runaway scenario. However, we found no evidence of a bow shock associated with any YHG or YSG in our sample, either in the literature or in our examination of Wide-Field Infrared Survey Explorer (WISE; Wright et al. 2010) images.
For stars whose H I-based and group-based distance estimates agree well, a runaway scenario is unlikely, as dynamical perturbations would affect the proper motion, radial velocity, or both, leading to inconsistent distances. An exception is HD 96918, whose proper motion agrees with OB associations no. 210/211 (Chemel et al. 2022), yielding a group distance of ![Mathematical equation: $\[2623_{-83}^{+88}\]$](/articles/aa/full_html/2026/04/aa58527-25/aa58527-25-eq14.png) pc, but the H I-based distance is ~500 pc or ~5000 pc. This discrepancy was already identified by Achmad et al. (1992), whose distance estimates of 2400 ± 900 pc and ~2200 pc from independent methods agree well with our group-based distance. If HD 96918 were a runaway, an apparent alignment with an OB association based on similar proper motion would be unlikely to provide a reliable distance. If HD 96918 has been dynamically perturbed, its radial velocity could deviate from the H I velocity, but the effect has not been significant enough to separate it from the stars in the OB association.
pc, but the H I-based distance is ~500 pc or ~5000 pc. This discrepancy was already identified by Achmad et al. (1992), whose distance estimates of 2400 ± 900 pc and ~2200 pc from independent methods agree well with our group-based distance. If HD 96918 were a runaway, an apparent alignment with an OB association based on similar proper motion would be unlikely to provide a reliable distance. If HD 96918 has been dynamically perturbed, its radial velocity could deviate from the H I velocity, but the effect has not been significant enough to separate it from the stars in the OB association.
Small offsets in proper motions (>2σ of the cluster mean) are observed for several cluster members: ϕ Cas, HD 18391, and RW Cep have minor proper motion offsets compared to other members of their clusters (Appendix C). HD 223767 has a projected on-sky offset of <0.1 deg of the open cluster King 12 and shares a similar distance of ~2800 pc, but its proper motion differs from that of cluster members by more than 3σ. HD 74180 lies near the open clusters Pismis 6 and Pismis 8, both at distances of ~1700 pc and separated by ~0.3 deg on sky, with proper motion differences of ~0.5 mas yr−1. These cluster may originate from the same molecular cloud (Fitzgerald et al. 1979). A proper motion difference of 0.5 mas yr−1 corresponds to a velocity difference of ~5 km s−1 at a distance of 2000 pc and ~7 km s−1 at 3000 pc, indicating small kinematical differences originating from modest dynamical interactions. Overall, while we found minor kinematic offsets for several stars, we found no clear evidence of runaway YHGs or YSGs in our sample.
6.3 Comments on binarity
The binary fraction for YSGs is not well constrained. Recently, a multiplicity study in the Small Magellanic Cloud (SMC) suggested that supergiants of spectral classes B, A, and F were born as effectively single stars or are products of binary mergers (Patrick et al. 2025). For AF-type supergiants in the SMC, the binary fraction was estimated to be smaller than 15% (Patrick et al. 2025). However, O’Grady et al. (2024) estimated the binary fraction of YSGs in the Magellanic Clouds at 20–60%. For reference, O-type stars in the Milky Way have a binary fraction of ~70–90% (Sana et al. 2012, 2014), and the observed binary fraction for RSGs in the SMC and Large Magellanic Cloud (LMC) is ~15–30% (Neugent et al. 2020; Dorda & Patrick 2021; Patrick et al. 2019, 2020; Dai et al. 2025).
We summarise that a majority of the well-studied YHGs are likely to have binary companions: HR 5171 is a double or triple system, where one companion might be interacting with the hypergiant (Chesneau et al. 2014). 6 Cas is an A+O-type supergiant binary (Maíz Apellániz et al. 2021a). V509 Cas has a likely B-type companion (Lobel et al. 2013). IRAS 17163-3907 has been suggested to have a binary companion (Wallström et al. 2017). ρ Cas, IRC + 10420, and [FMR2006] 15 have RUWE values higher than 1.22, which is the threshold commonly used as an indicator for unresolved binarity (Castro-Ginard et al. 2024). Only HD 179821 appears to be single, as it is unlikely to have a companion more massive than 5 M⊙ and a spectral class earlier than B5 (Jura & Werner 1999). Less information is available for the YSGs, but some confirmed cases of binarity include ϵ Aur, which is an eclipsing binary (Stefanik et al. 2010); HD 144812, which is an interacting binary (Kourniotis et al. 2025); V915 Sco, which has a Wolf-Rayet companion (Andrews 1977); V810 Cen, which is a spectroscopic binary (Kienzle et al. 1998); ϕ Cas and HD 57118, which have been identified as binaries (Burki & Mayor 1983); and HD 96918, HD 74180, and IRAS 18357-0604, which have high RUWE values.
Overall, about 50% of the YHGs and YSGs in our sample show direct or indirect signs of binarity, with a firm lower limit of 22% (eight confirmed binary systems). We selected our sample based on luminosity estimates in the literature and did not consider any binarity indicators. Nevertheless, these factors are correlated through the contribution of a hot companion to the overall luminosity of the system, which might introduce a bias towards identifying binaries.
7 Conclusions
We provided a homogeneous and consistent determination of distances for Galactic YSGs and YHGs. Because the Gaia parallaxes contain uncertainties, we explored an indirect method of determining the distance through membership identification with nearby stellar groups, that is, clusters or OB associations. We compared the proper motions of YHGs and YSGs with those of clusters (Hunt & Reffert 2024) and OB associations (Chemel et al. 2022; Mel’nik & Dambis 2017) in the surrounding sky region. Using the more reliable parallaxes of co-moving stars, we calculated group-based distances. We validated this method against the large-scale Galactic kinematics by comparing the stellar systemic radial velocities with the Galactic H I velocity map (Söding et al. 2025). Our H I-based distances agree well with previous studies, where distances were derived from comparison with the Galactic rotation curve. The two independent methods agree well for most of the targets.
We determined membership in a cluster or OB association for 20 YSGs. Five YSGs remain without a clearly identified stellar group, and two of them are likely too distant and reddened for the method. The stellar environments of YHGs are more varied:
Stellar cluster: RW Cep and [FMR2006] 15;
OB association: 6 Cas, V509 Cas, and HD 96918;
Star-forming region: HR 5171;
Unaffiliated: ρ Cas, IRAS 17163-3907, IRC +10420, and HD 179821.
We derived luminosities for 15 YSGs and five YHGs by combining our distance estimates with Teff values from the literature and angular diameters from the JSDC catalogue. Our results agree well in general with previous luminosity estimates. The upcoming Gaia DR4 will improve the astrometric measurements and allow for further studies of stellar environments surrounding YHGs and YSGs. A homogeneous interferometric survey of Galactic YSGs and YHGs would be valuable to better constrain the radii and luminosities, determine the binary fraction, and study the circumstellar environments. Future work will address the circumstellar environments and spectral energy distributions of YSGs and YHGs.
Data availability
The table in Appendix D is available at the CDS via https://cdsarc.cds.unistra.fr/viz-bin/cat/J/A+A/708/A78
Acknowledgements
We would like to thank Willem-Jan de Wit, Evgenia Koumpia, and Rain Kipper for insightful discussions. This work has made use of data from the European Space Agency (ESA) mission Gaia (https://www.cosmos.esa.int/gaia), processed by the Gaia Data Processing and Analysis Consortium (DPAC, https://www.cosmos.esa.int/web/gaia/dpac/consortium). Funding for the DPAC has been provided by national institutions, in particular the institutions participating in the Gaia Multilateral Agreement. This research has made use of the Jean-Marie Mariotti Center JSDC catalogue, which involves the JMDC catalogue. JSDC available at http://www.jmmc.fr/jsdc. Part of this work was supported by the Estonian Research Council grant PRG 2159. This research has made use of the VizieR catalogue access tool, CDS, Strasbourg, France.
References
- Aadland, E., Massey, P., Neugent, K. F., & Drout, M. R. 2018, AJ, 156, 294 [NASA ADS] [CrossRef] [Google Scholar]
- Achmad, L., Lamers, H. J. G. L. M., Nieuwenhuijzen, H., & van Genderen, A. M. 1992, A&A, 259, 600 [Google Scholar]
- Aidelman, Y., Cidale, L. S., Zorec, J., & Panei, J. A. 2015, A&A, 577, A45 [NASA ADS] [CrossRef] [EDP Sciences] [Google Scholar]
- Aldering, G., Humphreys, R. M., & Richmond, M. 1994, AJ, 107, 662 [Google Scholar]
- Anderson, L. D., Bania, T. M., Balser, D. S., et al. 2014, ApJS, 212, 1 [Google Scholar]
- Andrews, J. P. 1977, MNRAS, 178, 131 [Google Scholar]
- Anugu, N., Baron, F., Gies, D. R., et al. 2023, AJ, 166, 78 [NASA ADS] [CrossRef] [Google Scholar]
- Anugu, N., Baron, F., Monnier, J. D., et al. 2024, ApJ, 974, 113 [Google Scholar]
- Arellano Ferro, A., & Mantegazza, L. 1996, A&A, 315, 542 [NASA ADS] [Google Scholar]
- Arellano Ferro, A., & Parrao, L. 1990, A&A, 239, 205 [NASA ADS] [Google Scholar]
- Arellano Ferro, A., Parrao, L., & Giridhar, S. 1988, PASP, 100, 993 [Google Scholar]
- Arnal, E. M., Duronea, N. U., & Testori, J. C. 2008, A&A, 486, 807 [NASA ADS] [CrossRef] [EDP Sciences] [Google Scholar]
- Bailer-Jones, C. A. L., Rybizki, J., Fouesneau, M., Demleitner, M., & Andrae, R. 2021, AJ, 161, 147 [Google Scholar]
- Balona, L. A. 1982, MNRAS, 201, 105 [NASA ADS] [Google Scholar]
- Bekhti, N. B., Flöer, L., Keller, R., et al. 2016, A&A, 594, A116 [NASA ADS] [CrossRef] [EDP Sciences] [Google Scholar]
- Bersier, D. 1996, A&A, 308, 514 [NASA ADS] [Google Scholar]
- Boulon, J. 1963, J. Observ., 46, 243 [Google Scholar]
- Bourgés, L., Lafrasse, S., Mella, G., et al. 2014, in ASP Conference Series, 485, eds. N. Manset, & P. Forshay, 223 [Google Scholar]
- Bourges, L., Mella, G., Lafrasse, S., et al. 2017, VizieR Online Data Catalog:, 2346, II/346 [Google Scholar]
- Burki, G., & Mayor, M. 1983, A&A, 124, 256 [NASA ADS] [Google Scholar]
- Campillay, A. R., Arias, J. I., Barbá, R. H., et al. 2019, MNRAS, 484, 2137 [Google Scholar]
- Cantat-Gaudin, T., & Brandt, T. D. 2021, A&A, 649, A124 [NASA ADS] [CrossRef] [EDP Sciences] [Google Scholar]
- Carretero-Castrillo, M., Ribó, M., & Paredes, J. M. 2023, A&A, 679, A109 [NASA ADS] [CrossRef] [EDP Sciences] [Google Scholar]
- Carretero-Castrillo, M., Benaglia, P., Paredes, J. M., & Ribó, M. 2025, A&A, 694, A250 [NASA ADS] [CrossRef] [EDP Sciences] [Google Scholar]
- Castro-Ginard, A., McMillan, P. J., Luri, X., et al. 2021, A&A, 652, A162 [NASA ADS] [CrossRef] [EDP Sciences] [Google Scholar]
- Castro-Ginard, A., Penoyre, Z., Casey, A. R., et al. 2024, A&A, 688, A1 [NASA ADS] [CrossRef] [EDP Sciences] [Google Scholar]
- Chelli, A., Duvert, G., Bourgès, L., et al. 2016, A&A, 589, A112 [NASA ADS] [CrossRef] [EDP Sciences] [Google Scholar]
- Chemel, A. A., de Grijs, R., Glushkova, E. V., & Dambis, A. K. 2022, MNRAS, 515, 4359 [NASA ADS] [CrossRef] [Google Scholar]
- Chesneau, O., Meilland, A., Chapellier, E., et al. 2014, A&A, 563, A71 [NASA ADS] [CrossRef] [EDP Sciences] [Google Scholar]
- Chiavassa, A., Pasquato, E., Jorissen, A., et al. 2011, A&A, 528, A120 [NASA ADS] [CrossRef] [EDP Sciences] [Google Scholar]
- Clark, J. S., Negueruela, I., & González-Fernández, C. 2014, A&A, 561, A15 [NASA ADS] [CrossRef] [EDP Sciences] [Google Scholar]
- Crockett, R. M., Eldridge, J. J., Smartt, S. J., et al. 2008, MNRAS, 391, L5 [NASA ADS] [Google Scholar]
- Dai, M., Wang, S., & Jiang, B. 2025, MNRAS, 539, 1220 [Google Scholar]
- Damiani, F., Micela, G., & Sciortino, S. 2016, A&A, 596, A82 [NASA ADS] [CrossRef] [EDP Sciences] [Google Scholar]
- Davies, B., Figer, D. F., Kudritzki, R.-P., et al. 2007, ApJ, 671, 781 [NASA ADS] [CrossRef] [Google Scholar]
- Davies, B., Figer, D. F., Law, C. J., et al. 2008, ApJ, 676, 1016 [Google Scholar]
- de Jager, C. 1998, A&AR, 8, 145 [NASA ADS] [CrossRef] [Google Scholar]
- de Jager, C., & Nieuwenhuijzen, H. 1997, MNRAS, 290, L50 [NASA ADS] [Google Scholar]
- de la Fuente Marcos, R., & de la Fuente Marcos, C. 2009, New Astron., 14, 180 [Google Scholar]
- De Medeiros, J. R., Udry, S., Burki, G., & Mayor, M. 2002, A&A, 395, 97 [NASA ADS] [CrossRef] [EDP Sciences] [Google Scholar]
- Delgado, A. J., Djupvik, A. A., Costado, M. T., & Alfaro, E. J. 2013, MNRAS, 435, 429 [Google Scholar]
- Deman, J. A., & Oey, M. S. 2024, ApJ, 976, 125 [Google Scholar]
- Dorda, R., & Patrick, L. R. 2021, MNRAS, 502, 4890 [NASA ADS] [CrossRef] [Google Scholar]
- Dorigo Jones, J., Oey, M. S., Paggeot, K., Castro, N., & Moe, M. 2020, ApJ, 903, 43 [NASA ADS] [CrossRef] [Google Scholar]
- Dorn-Wallenstein, T. Z., Neugent, K. F., & Levesque, E. M. 2023, ApJ, 959, 102 [Google Scholar]
- Ekström, S., Georgy, C., Eggenberger, P., et al. 2012, A&A, 537, A146 [Google Scholar]
- El-Badry, K. 2025, Open J. Astrophys., 8, 62 [Google Scholar]
- El-Badry, K., Lam, C., Holl, B., et al. 2024, Open J. Astrophys., 7, 100 [Google Scholar]
- Fabricius, C., Luri, X., Arenou, F., et al. 2021, A&A, 649, A5 [NASA ADS] [CrossRef] [EDP Sciences] [Google Scholar]
- Figer, D. F., MacKenty, J. W., Robberto, M., et al. 2006, ApJ, 643, 1166 [Google Scholar]
- Fitton, S., Tofflemire, B. M., & Kraus, A. L. 2022, Res. Notes AAS, 6, 18 [Google Scholar]
- Fitzgerald, M. P., Boudreault, R., Fich, M., Luiken, M., & Witt, A. N. 1979, A&AS, 37, 351 [Google Scholar]
- Fletcher, E. S. 1963, AJ, 68, 407 [Google Scholar]
- Forbes, D., & Short, S. 1994, AJ, 108, 594 [Google Scholar]
- Froebrich, D., Schmeja, S., Samuel, D., & Lucas, P. W. 2010, MNRAS, 409, 1281 [NASA ADS] [CrossRef] [Google Scholar]
- Gaia Collaboration (Prusti, T., et al.) 2016, A&A, 595, A1 [NASA ADS] [CrossRef] [EDP Sciences] [Google Scholar]
- Gaia Collaboration (Montegriffo, P., et al.) 2023, A&A, 674, A33 [CrossRef] [EDP Sciences] [Google Scholar]
- Gontcharov, G. A. 2006, Astron. Lett., 32, 759 [Google Scholar]
- Gontcharov, G. A., Marchuk, A. A., Khovrichev, M. Y., et al. 2023, Astron. Lett., 49, 673 [Google Scholar]
- Groenewegen, M. a. T. 2020, A&A, 635, A33 [NASA ADS] [CrossRef] [EDP Sciences] [Google Scholar]
- Guinan, E. F., Mayer, P., Harmanec, P., et al. 2012, A&A, 546, A123 [NASA ADS] [CrossRef] [EDP Sciences] [Google Scholar]
- Hackwell, J. A., & Gehrz, R. D. 1974, ApJ, 194, 49 [Google Scholar]
- Hawkins, G. W., Skinner, C. J., Meixner, M. M., et al. 1995, ApJ, 452, 314 [Google Scholar]
- He, Z., Liu, X., Luo, Y., Wang, K., & Jiang, Q. 2023a, ApJS, 264, 8 [NASA ADS] [CrossRef] [Google Scholar]
- He, Z., Luo, Y., Wang, K., et al. 2023b, ApJS, 267, 34 [Google Scholar]
- Healy, S., Horiuchi, S., Colomer Molla, M., et al. 2024, MNRAS, 529, 3630 [NASA ADS] [CrossRef] [Google Scholar]
- Herbig, G. H. 1972, ApJ, 174, L89 [Google Scholar]
- Holl, B., Sozzetti, A., Sahlmann, J., et al. 2023, A&A, 674, A10 [NASA ADS] [CrossRef] [EDP Sciences] [Google Scholar]
- Humphreys, R. M. 1970, AJ, 75, 602 [NASA ADS] [CrossRef] [Google Scholar]
- Humphreys, R. M. 1978, ApJS, 38, 309 [NASA ADS] [CrossRef] [Google Scholar]
- Humphreys, R. M., Strecker, D. W., & Ney, E. P. 1971, ApJ, 167, L35 [Google Scholar]
- Humphreys, R. M., Davidson, K., & Smith, N. 2002, AJ, 124, 1026 [Google Scholar]
- Humphreys, R. M., Jones, T. J., & Martin, J. C. 2023, AJ, 166, 50 [NASA ADS] [CrossRef] [Google Scholar]
- Hunt, E. L., & Reffert, S. 2024, A&A, 686, A42 [NASA ADS] [CrossRef] [EDP Sciences] [Google Scholar]
- Ikonnikova, N. P., Taranova, O. G., Arkhipova, V. P., et al. 2018, Astron. Lett., 44, 457 [Google Scholar]
- Israelian, G., Lobel, A., & Schmidt, M. R. 1999, ApJ, 523, L145 [NASA ADS] [CrossRef] [Google Scholar]
- Jones, T. J., Humphreys, R. M., Gehrz, R. D., et al. 1993, ApJ, 411, 323 [NASA ADS] [CrossRef] [Google Scholar]
- Josselin, E., & Lèbre, A. 2001, A&A, 367, 826 [NASA ADS] [CrossRef] [EDP Sciences] [Google Scholar]
- Jura, M., & Werner, M. W. 1999, ApJ, 525, 113 [Google Scholar]
- Karr, J. L., Manoj, P., & Ohashi, N. 2009, ApJ, 697, 133 [Google Scholar]
- Kasikov, A., Kolka, I., Aret, A., Eenmäe, T., & Checha, V. 2024, A&A, 686, A270 [NASA ADS] [CrossRef] [EDP Sciences] [Google Scholar]
- Kasikov, A., Kolka, I., Aret, A., et al. 2025, A&A, 694, A153 [NASA ADS] [CrossRef] [EDP Sciences] [Google Scholar]
- Kienzle, F., Burki, G., Burnet, M., & Meynet, G. 1998, A&A, 337, 779 [Google Scholar]
- Kilpatrick, C. D., Foley, R. J., Abramson, L. E., et al. 2017, MNRAS, 465, 4650 [Google Scholar]
- Kipper, T. 2008, Baltic Astron., 17, 311 [Google Scholar]
- Klochkova, V. G. 2019, Astrophys. Bull., 74, 475 [Google Scholar]
- Klochkova, V. G., Chentsov, E. L., & Panchuk, V. E. 1997, MNRAS, 292, 19 [Google Scholar]
- Klochkova, V. G., Mishenina, T. V., & Panchuk, V. E. 2000, Astron. Lett., 26, 398 [Google Scholar]
- Klochkova, V. G., Panchuk, V. E., & Tavolganskaya, N. S. 2016, Astron. Lett., 42, 815 [Google Scholar]
- Koumpia, E., Oudmaijer, R. D., Graham, V., et al. 2020, A&A, 635, A183 [NASA ADS] [CrossRef] [EDP Sciences] [Google Scholar]
- Koumpia, E., Oudmaijer, R. D., de Wit, W.-J., et al. 2022, MNRAS, 515, 2766 [Google Scholar]
- Kourniotis, M., Kraus, M., Arias, M. L., & Cidale, L. S. 2025, MNRAS, 540, L28 [Google Scholar]
- Kovtyukh, V. V., Soubiran, C., Luck, R. E., et al. 2008, MNRAS, 389, 1336 [NASA ADS] [CrossRef] [Google Scholar]
- Kovtyukh, V. V., Chekhonadskikh, F. A., Luck, R. E., et al. 2010, MNRAS, 408, 1568 [NASA ADS] [CrossRef] [Google Scholar]
- Kovtyukh, V. V., Gorlova, N. I., & Belik, S. I. 2012, MNRAS, 423, 3268 [NASA ADS] [CrossRef] [Google Scholar]
- Lagadec, E., Zijlstra, A. A., Oudmaijer, R. D., et al. 2011, A&A, 534, L10 [NASA ADS] [CrossRef] [EDP Sciences] [Google Scholar]
- Lindegren, L., Bastian, U., Biermann, M., et al. 2021a, A&A, 649, A4 [EDP Sciences] [Google Scholar]
- Lindegren, L., Klioner, S. A., Hernández, J., et al. 2021b, A&A, 649, A2 [EDP Sciences] [Google Scholar]
- Lobel, A., Dupree, A. K., Stefanik, R. P., et al. 2003, ApJ, 583, 923 [NASA ADS] [CrossRef] [Google Scholar]
- Lobel, A., de Jager, K., & Nieuwenhuijzen, H. 2013, in ASP Conference Series, 470, eds. G. Pugliese, A. de Koter, & M. Wijburg, 167 [Google Scholar]
- Luck, R. E. 2014, AJ, 147, 137 [Google Scholar]
- Maas, T. 2003, Ph.D. thesis (Katholieke Universiteit Leuven) [Google Scholar]
- Mamajek, E. E., Torres, G., Prsa, A., et al. 2015, in IAU 2015 Resolution B2 [Google Scholar]
- Mantegazza, L. 1992, A&A, 265, 527 [NASA ADS] [Google Scholar]
- Maravelias, G., Bonanos, A. Z., Antoniadis, K., et al. 2026, A&A, in press, https://doi.org/10.1051/0004-6361/202554866 [NASA ADS] [CrossRef] [EDP Sciences] [Google Scholar]
- Marco, A., Negueruela, I., Castro, N., & Simón-Díaz, S. 2025, MNRAS, 542, 703 [Google Scholar]
- Martin, J. C., & Humphreys, R. M. 2023, AJ, 166, 214 [Google Scholar]
- Martin, J. C., Humphreys, R. M., & Davidson, K. 2025, arXiv e-prints [arXiv:2508.17114] [Google Scholar]
- Maund, J. R., Fraser, M., Ergon, M., et al. 2011, ApJ, 739, L37 [Google Scholar]
- Maíz Apellániz, J., & Negueruela, I. 2025, in Proceedings of the XVI Scientific Meeting of the Spanish Astronomical Society, eds. M. Manteiga, F. G. Galindo, A. L. Ortega, M. M. González, N. Rea, M. R. Gómez, A. U. Miguel, G. Yepes, C. R. López, A. G. García, & C. Dafonte, 224 [Google Scholar]
- Maíz Apellániz, J., Barbá, R. H., Fariña, C., et al. 2021a, A&A, 646, A11 [NASA ADS] [CrossRef] [EDP Sciences] [Google Scholar]
- Maíz Apellániz, J., Pantaleoni González, M., & Barbá, R. H. 2021b, A&A, 649, A13 [NASA ADS] [CrossRef] [EDP Sciences] [Google Scholar]
- McClure-Griffiths, N. M., Stanimirović, S., & Rybarczyk, D. R. 2023, ARA&A, 61, 19 [Google Scholar]
- Mel’nik, A. M., & Dambis, A. K. 2017, MNRAS, 472, 3887 [Google Scholar]
- Melnik, A. M., & Dambis, A. K. 2020, MNRAS, 493, 2339 [NASA ADS] [CrossRef] [Google Scholar]
- Miroshnichenko, A. S., Zharikov, S. V., Vaidman, N. L., & Khokhlov, S. A. 2025, in Proceedings of the IAU Symposium, 402, eds. A. Wofford, N. St-Louis, M. Garcia, & S. Simón-Díaz (Cambridge University Press) [Google Scholar]
- Moffat, A. F. J., Fitzgerald, M. P., & Jackson, P. D. 1977, ApJ, 215, 106 [Google Scholar]
- Nakanishi, H., & Sofue, Y. 2003, PASJ, 55, 191 [Google Scholar]
- Nedoluha, G. E., & Bowers, P. F. 1992, ApJ, 392, 249 [Google Scholar]
- Negueruela, I., Alfaro, E. J., Dorda, R., et al. 2022, A&A, 664, A146 [NASA ADS] [CrossRef] [EDP Sciences] [Google Scholar]
- Neugent, K. F., Levesque, E. M., Massey, P., Morrell, N. I., & Drout, M. R. 2020, ApJ, 900, 118 [CrossRef] [Google Scholar]
- Nieuwenhuijzen, H., De Jager, C., Kolka, I., et al. 2012, A&A, 546, A105 [NASA ADS] [CrossRef] [EDP Sciences] [Google Scholar]
- Niu, Z., Sun, N.-C., & Liu, J. 2024, ApJ, 970, L9 [Google Scholar]
- O’Grady, A. J. G., Drout, M. R., Neugent, K. F., et al. 2024, ApJ, 975, 29 [Google Scholar]
- Oksala, M. E., Kraus, M., Cidale, L. S., Muratore, M. F., & Borges Fernandes, M. 2013, A&A, 558, A17 [NASA ADS] [CrossRef] [EDP Sciences] [Google Scholar]
- Oudmaijer, R. D. 1998, A&AS, 129, 541 [Google Scholar]
- Oudmaijer, R. D., Groenewegen, M. A. T., Matthews, H. E., Blommaert, J. A. D. L., & Sahu, K. C. 1996, MNRAS, 280, 1062 [Google Scholar]
- Oudmaijer, R. D., Jones, E. R. M., & Vioque, M. 2022, MNRAS, 516, L61 [NASA ADS] [CrossRef] [Google Scholar]
- Parsons, S. B. 1981, ApJ, 245, 201 [Google Scholar]
- Pasquato, E., Pourbaix, D., & Jorissen, A. 2011, A&A, 532, A13 [NASA ADS] [CrossRef] [EDP Sciences] [Google Scholar]
- Patrick, L. R., Lennon, D. J., Britavskiy, N., et al. 2019, A&A, 624, A129 [NASA ADS] [CrossRef] [EDP Sciences] [Google Scholar]
- Patrick, L. R., Lennon, D. J., Evans, C. J., et al. 2020, A&A, 635, A29 [NASA ADS] [CrossRef] [EDP Sciences] [Google Scholar]
- Patrick, L. R., Lennon, D. J., Najarro, F., et al. 2025, A&A, 698, A39 [NASA ADS] [CrossRef] [EDP Sciences] [Google Scholar]
- Perren, G., Vázquez, R., & Carraro, G. 2012, A&A, 548, A125 [NASA ADS] [CrossRef] [EDP Sciences] [Google Scholar]
- Quintana, A. L., Negueruela, I., & Berlanas, S. R. 2025, A&A, 697, A47 [NASA ADS] [CrossRef] [EDP Sciences] [Google Scholar]
- Rastorguev, A. S., Glushkova, E. V., Dambis, A. K., & Zabolotskikh, M. V. 1999, Astron. Lett., 25, 595 [NASA ADS] [Google Scholar]
- Reddy, B. E., & Hrivnak, B. J. 1999, AJ, 117, 1834 [Google Scholar]
- Reed, B. C. 2000, AJ, 119, 1855 [Google Scholar]
- Reguitti, A., Pastorello, A., Smartt, S. J., et al. 2025, A&A, 698, A129 [NASA ADS] [CrossRef] [EDP Sciences] [Google Scholar]
- Robinson, G., Thomas, J. A., Hirst, R. A., & Hyland, A. R. 1973, PASP, 85, 436 [Google Scholar]
- Rosenzweig, P., & Anderson, L. 1993, ApJ, 411, 207 [Google Scholar]
- Şahin, T., Lambert, D. L., Klochkova, V. G., & Panchuk, V. E. 2016, MNRAS, 461, 4071 [CrossRef] [Google Scholar]
- Sana, H., de Mink, S. E., de Koter, A., et al. 2012, Science, 337, 444 [Google Scholar]
- Sana, H., Le Bouquin, J.-B., Lacour, S., et al. 2014, ApJS, 215, 15 [Google Scholar]
- Smith, N., & Tombleson, R. 2015, MNRAS, 447, 598 [NASA ADS] [CrossRef] [Google Scholar]
- Smith, N., Aghakhanloo, M., Murphy, J. W., et al. 2019, MNRAS, 488, 1760 [NASA ADS] [CrossRef] [Google Scholar]
- Smolinski, J., Climenhaga, J. L., & Harris, B. L. 1980, Acta Astron., 30, 427 [Google Scholar]
- Stefanik, R. P., Torres, G., Lovegrove, J., et al. 2010, AJ, 139, 1254 [Google Scholar]
- Stothers, R. B. 2012, ApJ, 751, 151 [Google Scholar]
- Straižys, V., Kazlauskas, A., Boyle, R. P., et al. 2021, AJ, 162, 224 [CrossRef] [Google Scholar]
- Strassmeier, K. G., Weber, M., Granzer, T., et al. 2014, Astron. Nachr., 335, 904 [Google Scholar]
- Söding, L., Edenhofer, G., Enßlin, T., et al. 2024, Zenodo [zenodo:12578443] [Google Scholar]
- Söding, L., Edenhofer, G., Enßlin, T. A., et al. 2025, A&A, 693, A139 [CrossRef] [EDP Sciences] [Google Scholar]
- Tartaglia, L., Fraser, M., Sand, D. J., et al. 2017, ApJ, 836, L12 [NASA ADS] [CrossRef] [Google Scholar]
- Turner, D. G. 1982, PASP, 94, 655 [Google Scholar]
- Turner, D. G., Kovtyukh, V. V., Majaess, D. J., Lane, D. J., & Moncrieff, K. E. 2009, Astron. Nachr., 330, 807 [Google Scholar]
- Usenko, I. A., Kniazev, A. Y., Berdnikov, L. N., & Kravtsov, V. V. 2011, Astron. Lett., 37, 499 [NASA ADS] [CrossRef] [Google Scholar]
- van Belle, G. T., Creech-Eakman, M. J., & Hart, A. 2009, MNRAS, 394, 1925 [NASA ADS] [CrossRef] [Google Scholar]
- van Genderen, A. M., Lobel, A., Nieuwenhuijzen, H., et al. 2019, A&A, 631, A48 [NASA ADS] [CrossRef] [EDP Sciences] [Google Scholar]
- van Genderen, A. M., Lobel, A., Timmerman, R., et al. 2025, A&A, 694, A136 [NASA ADS] [CrossRef] [EDP Sciences] [Google Scholar]
- Vasquez, J., Cappa, C., & McClure-Griffiths, N. M. 2005, MNRAS, 362, 681 [NASA ADS] [CrossRef] [Google Scholar]
- Wallström, S. H. J., Muller, S., Lagadec, E., et al. 2015, A&A, 574, A139 [NASA ADS] [CrossRef] [EDP Sciences] [Google Scholar]
- Wallström, S. H. J., Lagadec, E., Muller, S., et al. 2017, A&A, 597, A99 [NASA ADS] [CrossRef] [EDP Sciences] [Google Scholar]
- Wang, S., Jiang, B. W., Zhao, H., Chen, X., & de Grijs, R. 2017, ApJ, 848, 106 [NASA ADS] [CrossRef] [Google Scholar]
- Wegner, W. 2006, MNRAS, 371, 185 [NASA ADS] [CrossRef] [Google Scholar]
- White, S. D. M. 1975, ApJ, 197, 67 [Google Scholar]
- Wright, E. L., Eisenhardt, P. R. M., Mainzer, A. K., et al. 2010, AJ, 140, 1868 [Google Scholar]
- Wu, Y. W., Xu, Y., Menten, K. M., Zheng, X. W., & Reid, M. J. 2012, in Proceedings of the IAU Symposium, 287, eds. R. Booth, E. Humphreys, & W. Vlemmings, 425 [Google Scholar]
- Zsoldos, E., & Percy, J. R. 1991, A&A, 246, 441 [NASA ADS] [Google Scholar]
Using the Python code provided at https://gitlab.com/icc-ub/public/gaiadr3_zeropoint
Using the interactive Jupyter Notebook based tool https://github.com/ElisaHaas25/Interactive-Distance-Estimation
NASA/JPL-Caltech/R. Hurt (SSC/Caltech).
Appendix A Distance results
Distances and cluster/OB association memberships for YSGs and YHGs.
Appendix B Notes on individual targets
In this section we provide a brief overview of the analysis performed for the individual targets. Unless stated otherwise, the parameters used to select nearby stars are the same as those described in Sect. 3.
ϕ Cas. The Gaia DR3 parallax is low-quality (ϖ/σϖ = 2.6). Its on-sky location coincides with the cluster NGC 457 (2800 ± 9 pc; Hunt & Reffert 2024) and it has been included as a cluster member (Arellano Ferro & Parrao 1990; Rastorguev et al. 1999). Its proper motion does not support cluster membership, but the errors are relatively large (~0.06 mas yr−1). We applied a 0.4 mas yr−1 proper motion cut around ϕ Cas’ value on stars within 10′ of the target. We calculated a group distance of ![Mathematical equation: $\[2920_{-113}^{+114}\]$](/articles/aa/full_html/2026/04/aa58527-25/aa58527-25-eq78.png) pc, consistent with membership in cluster NGC 457. The radial velocity of ϕ Cas from Gaia DR3 is −19.2 ± 3 km s−1, while other studies report values near −28 km s−1 (Arellano Ferro et al. 1988; Rosenzweig & Anderson 1993). The last is similar to the cluster radial velocity of −34 km s−1 (Rastorguev et al. 1999). Using the radial velocity −28 km s−1, we found a H I-based distance in the range of 1000–1800 pc, much closer than the cluster. Both the star’s and the cluster’s radial velocities are inconsistent with the H I radial velocity at 2800 pc. We found the cluster NGC 457 to be the most likely origin population.
pc, consistent with membership in cluster NGC 457. The radial velocity of ϕ Cas from Gaia DR3 is −19.2 ± 3 km s−1, while other studies report values near −28 km s−1 (Arellano Ferro et al. 1988; Rosenzweig & Anderson 1993). The last is similar to the cluster radial velocity of −34 km s−1 (Rastorguev et al. 1999). Using the radial velocity −28 km s−1, we found a H I-based distance in the range of 1000–1800 pc, much closer than the cluster. Both the star’s and the cluster’s radial velocities are inconsistent with the H I radial velocity at 2800 pc. We found the cluster NGC 457 to be the most likely origin population.
HD 10494. The Gaia DR3 parallax is high-quality (ϖ/σϖ = 19.8), resulting in a distance of ![Mathematical equation: $\[2823_{-114}^{+142}\]$](/articles/aa/full_html/2026/04/aa58527-25/aa58527-25-eq79.png) pc (Bailer-Jones et al. 2021). The on-sky location of HD 10494 coincides with the cluster NGC 654 (2815 ± 11 pc; Hunt & Reffert 2024) and the star has been included as a cluster member (Arellano Ferro & Parrao 1990; Rastorguev et al. 1999) and a member of the OB association Cas OB8 in the same sky region (Mel’nik & Dambis 2017). Its proper motion is in good agreement (2σ) with cluster membership. The proper motion also aligns very well with the OB association no. 150 at a distance of 2626 pc (Chemel et al. 2022). We applied a 0.2 mas yr−1 proper motion cut around HD 10494’s value on stars within 10′ of the target. We calculated a group distance of
pc (Bailer-Jones et al. 2021). The on-sky location of HD 10494 coincides with the cluster NGC 654 (2815 ± 11 pc; Hunt & Reffert 2024) and the star has been included as a cluster member (Arellano Ferro & Parrao 1990; Rastorguev et al. 1999) and a member of the OB association Cas OB8 in the same sky region (Mel’nik & Dambis 2017). Its proper motion is in good agreement (2σ) with cluster membership. The proper motion also aligns very well with the OB association no. 150 at a distance of 2626 pc (Chemel et al. 2022). We applied a 0.2 mas yr−1 proper motion cut around HD 10494’s value on stars within 10′ of the target. We calculated a group distance of ![Mathematical equation: $\[2784_{-61}^{+57}\]$](/articles/aa/full_html/2026/04/aa58527-25/aa58527-25-eq80.png) pc, very similar to the Bailer-Jones et al. (2021) distance. The radial velocity from Gaia DR3, −30.6 km s−1, agrees well with the cluster velocity of −33.8 km s−1 (Rastorguev et al. 1999). We found a H I-based distance in the range of 1000–1800 pc, with a similar discrepancy as for ϕ Cas. The two stars lie within 5° of each other on the sky, which corresponds to a physical distance of ~270 pc at their group-based distances.
pc, very similar to the Bailer-Jones et al. (2021) distance. The radial velocity from Gaia DR3, −30.6 km s−1, agrees well with the cluster velocity of −33.8 km s−1 (Rastorguev et al. 1999). We found a H I-based distance in the range of 1000–1800 pc, with a similar discrepancy as for ϕ Cas. The two stars lie within 5° of each other on the sky, which corresponds to a physical distance of ~270 pc at their group-based distances.
HD 12399. The Gaia DR3 parallax is high-quality (ϖ/σϖ = 14.3), resulting in a distance of ![Mathematical equation: $\[3792_{-192}^{+240}\]$](/articles/aa/full_html/2026/04/aa58527-25/aa58527-25-eq81.png) pc (Bailer-Jones et al. 2021). Its on-sky location and proper motion are not aligned with any known cluster or OB association. We applied a 0.3 mas yr−1 proper motion cut around HD 12399’s value on stars within 10′ of the target. Most stars within the cut have distances >3500 pc, but their parallaxes are low quality. There are six foreground stars at 2200–2700 pc, but given the high-quality parallax of HD 12399, the farther population is more likely. Among the more distant stars, only four stars have ϖ/σϖ > 5. We calculated a group distance of
pc (Bailer-Jones et al. 2021). Its on-sky location and proper motion are not aligned with any known cluster or OB association. We applied a 0.3 mas yr−1 proper motion cut around HD 12399’s value on stars within 10′ of the target. Most stars within the cut have distances >3500 pc, but their parallaxes are low quality. There are six foreground stars at 2200–2700 pc, but given the high-quality parallax of HD 12399, the farther population is more likely. Among the more distant stars, only four stars have ϖ/σϖ > 5. We calculated a group distance of ![Mathematical equation: $\[3564_{-266}^{+320}\]$](/articles/aa/full_html/2026/04/aa58527-25/aa58527-25-eq82.png) pc. Using the Gaia DR3 radial velocity of −44 ± 8 km s−1, we found a H I-based distance in the range of 2000–3200 pc.
pc. Using the Gaia DR3 radial velocity of −44 ± 8 km s−1, we found a H I-based distance in the range of 2000–3200 pc.
HD 18391. The Gaia DR3 parallax is high-quality (ϖ/σϖ = 18.6), resulting in a distance of ![Mathematical equation: $\[2263_{-93}^{+113}\]$](/articles/aa/full_html/2026/04/aa58527-25/aa58527-25-eq83.png) (Bailer-Jones et al. 2021). The on-sky location of HD 18391 coincides with the sparse open cluster SAI 25 (2252 ± 11 pc; Hunt & Reffert 2024), Turner et al. (2009) described its home cluster as ‘Anonymous’ and determined a shorter distance of 1661 ± 73 pc. Its proper motion is in agreement (3σ) with membership in SAI 25. The proper motion also aligns very well with the OB association no. 143 at a distance of 2262 pc (Chemel et al. 2022). We applied a 0.3 mas yr−1 proper motion cut around HD 18391’s value on stars within 10′ of the target. We calculated a group distance of
(Bailer-Jones et al. 2021). The on-sky location of HD 18391 coincides with the sparse open cluster SAI 25 (2252 ± 11 pc; Hunt & Reffert 2024), Turner et al. (2009) described its home cluster as ‘Anonymous’ and determined a shorter distance of 1661 ± 73 pc. Its proper motion is in agreement (3σ) with membership in SAI 25. The proper motion also aligns very well with the OB association no. 143 at a distance of 2262 pc (Chemel et al. 2022). We applied a 0.3 mas yr−1 proper motion cut around HD 18391’s value on stars within 10′ of the target. We calculated a group distance of ![Mathematical equation: $\[2242_{-52}^{+49}\]$](/articles/aa/full_html/2026/04/aa58527-25/aa58527-25-eq84.png) pc. Using the Gaia DR3 radial velocity of −39 ± 3 km s−1, we found a H I-based distance in the range of 2000–2800 pc.
pc. Using the Gaia DR3 radial velocity of −39 ± 3 km s−1, we found a H I-based distance in the range of 2000–2800 pc.
ϵ Aur. The Gaia DR3 parallax is medium-quality (ϖ/σϖ = 5.5) resulting in a distance of ![Mathematical equation: $\[1056_{-182}^{+218}\]$](/articles/aa/full_html/2026/04/aa58527-25/aa58527-25-eq85.png) pc (Bailer-Jones et al. 2021). It has a high RUWE value of 1.71 and large proper motion uncertainties (~0.2 mas yr−1). Its on-sky location and proper motion are not aligned with any known cluster. It has been identified as a member of the Aur OB1 association (Arellano Ferro & Parrao 1990; Mel’nik & Dambis 2017). On-sky, it is close to OB association no. 147 at a distance of 1154 pc (Chemel et al. 2022), though its proper motion differs by ~0.6 mas yr−1 from the association members. But given the large errors, we consider the proper motions similar enough. Within 20′ of the target we found most stars at distances >2000 pc. There are very few hot stars at ~1000 pc, and they are scattered in proper motions. We applied a very wide 1.6 mas yr−1 proper motion cut around ϵ Aur’s value and found only four stars. The group-based distance is 1127 ± 31 pc. Using the radial velocity of −2.3 km s−1 (Stefanik et al. 2010), we found a H I-based distance of ~700 pc, consistent with the closer group distance.
pc (Bailer-Jones et al. 2021). It has a high RUWE value of 1.71 and large proper motion uncertainties (~0.2 mas yr−1). Its on-sky location and proper motion are not aligned with any known cluster. It has been identified as a member of the Aur OB1 association (Arellano Ferro & Parrao 1990; Mel’nik & Dambis 2017). On-sky, it is close to OB association no. 147 at a distance of 1154 pc (Chemel et al. 2022), though its proper motion differs by ~0.6 mas yr−1 from the association members. But given the large errors, we consider the proper motions similar enough. Within 20′ of the target we found most stars at distances >2000 pc. There are very few hot stars at ~1000 pc, and they are scattered in proper motions. We applied a very wide 1.6 mas yr−1 proper motion cut around ϵ Aur’s value and found only four stars. The group-based distance is 1127 ± 31 pc. Using the radial velocity of −2.3 km s−1 (Stefanik et al. 2010), we found a H I-based distance of ~700 pc, consistent with the closer group distance.
HD 57118. The Gaia DR3 parallax is high-quality (ϖ/σϖ = 18), resulting in a distance of ![Mathematical equation: $\[2759_{-138}^{+116}\]$](/articles/aa/full_html/2026/04/aa58527-25/aa58527-25-eq86.png) pc. It is a member of the OB association no. 25 at a distance of 2524 pc (Chemel et al. 2022). We applied a 1 mas yr−1 proper motion cut around HD 57118’s value on stars within 10′ of the target. We calculated a group distance of
pc. It is a member of the OB association no. 25 at a distance of 2524 pc (Chemel et al. 2022). We applied a 1 mas yr−1 proper motion cut around HD 57118’s value on stars within 10′ of the target. We calculated a group distance of ![Mathematical equation: $\[2790_{-93}^{+88}\]$](/articles/aa/full_html/2026/04/aa58527-25/aa58527-25-eq87.png) pc. Using the Gaia DR3 radial velocity 61.2 ± 1.4 km s−1, we found a H I-based distance of ~3300 pc.
pc. Using the Gaia DR3 radial velocity 61.2 ± 1.4 km s−1, we found a H I-based distance of ~3300 pc.
R Pup. The Gaia DR3 parallax is high-quality (ϖ/σϖ = 13.5), resulting in a distance of ![Mathematical equation: $\[3958_{-228}^{+291}\]$](/articles/aa/full_html/2026/04/aa58527-25/aa58527-25-eq88.png) pc. The on-sky location of R Pup coincides with the cluster NGC 2439 (3350 ± 13 pc; Hunt & Reffert 2024) of which it is a member (Arellano Ferro & Parrao 1990; White 1975). Its proper motion is in good agreement (1σ) with cluster membership. The proper motion also aligns very well with the OB association no. 68 at a distance of 3237 pc (Chemel et al. 2022). We applied a 0.1 mas yr−1 proper motion cut around R Pup’s value on stars within 10′ of the target. We calculated a group distance of
pc. The on-sky location of R Pup coincides with the cluster NGC 2439 (3350 ± 13 pc; Hunt & Reffert 2024) of which it is a member (Arellano Ferro & Parrao 1990; White 1975). Its proper motion is in good agreement (1σ) with cluster membership. The proper motion also aligns very well with the OB association no. 68 at a distance of 3237 pc (Chemel et al. 2022). We applied a 0.1 mas yr−1 proper motion cut around R Pup’s value on stars within 10′ of the target. We calculated a group distance of ![Mathematical equation: $\[3331_{-80}^{+77}\]$](/articles/aa/full_html/2026/04/aa58527-25/aa58527-25-eq89.png) pc. Using the radial velocity of 62.5 km s−1 (Balona 1982), we found a H I-based distance of ~4000 pc.
pc. Using the radial velocity of 62.5 km s−1 (Balona 1982), we found a H I-based distance of ~4000 pc.
HD 74180. The Gaia DR3 parallax is medium-quality (ϖ/σϖ = 4.3), resulting in a distance of ![Mathematical equation: $\[2532_{-397}^{+600}\]$](/articles/aa/full_html/2026/04/aa58527-25/aa58527-25-eq90.png) pc. It has high RUWE value of 2.56 and large proper motion uncertainties (~0.1 mas yr−1). It has been identified as a member of the Vel OB1 association (Mel’nik & Dambis 2017; Humphreys 1978; Reed 2000). The proper motion aligns with the OB association no. 107 at a distance of 1935 pc (Chemel et al. 2022). The star has been proposed to be affiliated with the region of the open cluster NGC 2645 (Pismis 6; Forbes & Short 1994) at a distance of 1720 ± 5 pc (Hunt & Reffert 2024), although it is not considered a member (Aidelman et al. 2015). Its proper motion has a ~0.5 mas yr−1 offset from the members of NGC 2645. The cluster radial velocity of 20.8 ± 3 km s−1 (Rastorguev et al. 1999) is similar to the radial velocity of HD 74180 of 25 ± 3 km s−1 (Forbes & Short 1994). We applied a 0.5 mas yr−1 proper motion cut around HD 74180’s value on stars within 20′ of the target. Hot stars with similar proper motion to HD 74180 are located at cluster distance. Because its proper motion does not align clearly with the cluster, we do not count it as a member, but we found it to be affiliated with the same region, in agreement with Forbes & Short (1994). We calculated a group distance of
pc. It has high RUWE value of 2.56 and large proper motion uncertainties (~0.1 mas yr−1). It has been identified as a member of the Vel OB1 association (Mel’nik & Dambis 2017; Humphreys 1978; Reed 2000). The proper motion aligns with the OB association no. 107 at a distance of 1935 pc (Chemel et al. 2022). The star has been proposed to be affiliated with the region of the open cluster NGC 2645 (Pismis 6; Forbes & Short 1994) at a distance of 1720 ± 5 pc (Hunt & Reffert 2024), although it is not considered a member (Aidelman et al. 2015). Its proper motion has a ~0.5 mas yr−1 offset from the members of NGC 2645. The cluster radial velocity of 20.8 ± 3 km s−1 (Rastorguev et al. 1999) is similar to the radial velocity of HD 74180 of 25 ± 3 km s−1 (Forbes & Short 1994). We applied a 0.5 mas yr−1 proper motion cut around HD 74180’s value on stars within 20′ of the target. Hot stars with similar proper motion to HD 74180 are located at cluster distance. Because its proper motion does not align clearly with the cluster, we do not count it as a member, but we found it to be affiliated with the same region, in agreement with Forbes & Short (1994). We calculated a group distance of ![Mathematical equation: $\[1657_{-34}^{+33}\]$](/articles/aa/full_html/2026/04/aa58527-25/aa58527-25-eq91.png) pc. Using the radial velocity of 25 km s−1 (Forbes & Short 1994), we found a H I-based distance in the range of 1500–2000 pc.
pc. Using the radial velocity of 25 km s−1 (Forbes & Short 1994), we found a H I-based distance in the range of 1500–2000 pc.
HD 75276. The Gaia DR3 parallax is high-quality (ϖ/σϖ = 19), resulting in a distance of ![Mathematical equation: $\[1443_{-57}^{+74}\]$](/articles/aa/full_html/2026/04/aa58527-25/aa58527-25-eq92.png) pc. It has been identified as a member of the Vel OB1 association (Mel’nik & Dambis 2017; Reed 2000). The proper motion aligns with the OB association no. 106 at a distance of 1447 pc or no. 107 at a distance of 1935 pc (Chemel et al. 2022). In the 10′ field of view, there is a low number of hot stars with similar proper motions and parallax, and there is a significant distant population at ~3000 pc. We applied a 0.7 mas yr−1 proper motion cut around HD 75276’s value on stars within 10′ of the target and excluded the background stars. We calculated a group distance of 1538 ± 24 pc. Using the Gaia DR3 radial velocity of ~26 km s−1, we found a H I-based distance of ~1500 pc. De Medeiros et al. (2002) suggested a slightly lower velocity of 21 km s−1 and Reed (2000) derived a higher velocity of ~32 km s−1. These velocities decrease or increase the distance estimate by a couple of hundred parsecs.
pc. It has been identified as a member of the Vel OB1 association (Mel’nik & Dambis 2017; Reed 2000). The proper motion aligns with the OB association no. 106 at a distance of 1447 pc or no. 107 at a distance of 1935 pc (Chemel et al. 2022). In the 10′ field of view, there is a low number of hot stars with similar proper motions and parallax, and there is a significant distant population at ~3000 pc. We applied a 0.7 mas yr−1 proper motion cut around HD 75276’s value on stars within 10′ of the target and excluded the background stars. We calculated a group distance of 1538 ± 24 pc. Using the Gaia DR3 radial velocity of ~26 km s−1, we found a H I-based distance of ~1500 pc. De Medeiros et al. (2002) suggested a slightly lower velocity of 21 km s−1 and Reed (2000) derived a higher velocity of ~32 km s−1. These velocities decrease or increase the distance estimate by a couple of hundred parsecs.
V709 Car. The Gaia DR3 parallax is high-quality (ϖ/σϖ = 8.1), resulting in a distance of ![Mathematical equation: $\[4006_{-376}^{+397}\]$](/articles/aa/full_html/2026/04/aa58527-25/aa58527-25-eq93.png) . We did not find alignment with any known cluster or OB association. In the 10′ field of view there is a significant population of hot stars at ~4000 pc with proper motions similar to V709 Car, but their parallax errors are large. We applied a 0.25 mas yr−1 proper motion cut around V709 Car’s value, excluded likely foreground stars at ~2000 pc, and relaxed the parallax quality criterion to ϖ/σϖ = 3. We calculated a group distance of
. We did not find alignment with any known cluster or OB association. In the 10′ field of view there is a significant population of hot stars at ~4000 pc with proper motions similar to V709 Car, but their parallax errors are large. We applied a 0.25 mas yr−1 proper motion cut around V709 Car’s value, excluded likely foreground stars at ~2000 pc, and relaxed the parallax quality criterion to ϖ/σϖ = 3. We calculated a group distance of ![Mathematical equation: $\[3817_{-271}^{+315}\]$](/articles/aa/full_html/2026/04/aa58527-25/aa58527-25-eq94.png) pc. V709 Car is a binary system with a period of 323 days, its radial velocity varies between ~6 − 18 km s−1 (Maas 2003). Using an average radial velocity of 12 km s−1, we found a H I-based distance of ~3600 pc.
pc. V709 Car is a binary system with a period of 323 days, its radial velocity varies between ~6 − 18 km s−1 (Maas 2003). Using an average radial velocity of 12 km s−1, we found a H I-based distance of ~3600 pc.
TYC 8958-479-1. The Gaia DR3 parallax is medium-quality (ϖ/σϖ = 3), resulting in a distance of ![Mathematical equation: $\[8783_{-1330}^{+2122}\]$](/articles/aa/full_html/2026/04/aa58527-25/aa58527-25-eq95.png) pc. Maíz Apellániz & Negueruela (2025) identified the star as a member of the open cluster Barbá 2 at a distance of
pc. Maíz Apellániz & Negueruela (2025) identified the star as a member of the open cluster Barbá 2 at a distance of ![Mathematical equation: $\[7390_{-550}^{+650}\]$](/articles/aa/full_html/2026/04/aa58527-25/aa58527-25-eq96.png) . Its proper motion also aligns with the OB association no. 8 (Chemel et al. 2022) at a distance of 6917 pc. The Barbá 2 cluster is not included in the Hunt & Reffert (2024) catalogue, thus we do not include cluster membership in the identified cluster column of Table A.1. We applied a 0.1 mas yr−1 proper motion cut around TYC 8958-479-1’s value on stars within 10′ of the target and identified four hot stars at this large distance with reliable parallaxes. We calculated a group distance of
. Its proper motion also aligns with the OB association no. 8 (Chemel et al. 2022) at a distance of 6917 pc. The Barbá 2 cluster is not included in the Hunt & Reffert (2024) catalogue, thus we do not include cluster membership in the identified cluster column of Table A.1. We applied a 0.1 mas yr−1 proper motion cut around TYC 8958-479-1’s value on stars within 10′ of the target and identified four hot stars at this large distance with reliable parallaxes. We calculated a group distance of ![Mathematical equation: $\[7025_{-572}^{+687}\]$](/articles/aa/full_html/2026/04/aa58527-25/aa58527-25-eq97.png) pc. We are unaware of any radial velocity measurements to compare with the H I kinematics.
pc. We are unaware of any radial velocity measurements to compare with the H I kinematics.
HD 96918. The Gaia DR3 parallax is low-quality (ϖ/σϖ = 2.2). The star has a high RUWE value of 1.99 and large proper motion uncertainties (~0.1 mas yr−1). It has been identified as a member of the Car OB2 association (Mel’nik & Dambis 2017; Humphreys 1978). On the sky, it is located at the edge of the open cluster NGC 3532 (distance 472 pc; Hunt & Reffert 2024), but its proper motion differs from the cluster members by ~4 mas yr−1, and thus is incompatible with membership. We found a relatively good alignment in proper motion with the OB associations 210 and 211 at distances of 2362 pc and 2450 pc (Chemel et al. 2022), but they are ~1° away on the sky. We applied a 0.4 mas yr−1 proper motion cut around HD 96918’s value on stars within 10′ of the target. We found stellar populations at ~2500 pc and at ~4000 pc. Based on previous distance estimates in the literature − 1900 pc (Luck 2014), 2000 pc (Groenewegen 2020), and 2700 pc (Achmad et al. 1992) − HD 96918 is more likely part of the closer population. We calculated a group distance of ![Mathematical equation: $\[2623_{-83}^{+88}\]$](/articles/aa/full_html/2026/04/aa58527-25/aa58527-25-eq98.png) pc. Using the radial velocity of 5.6 km s−1 (Balona 1982), we found a H I-based distance of ~5000 pc or ~500 pc, similar to the result found by Achmad et al. (1992). This discrepancy is addressed in Sect. 4.3.
pc. Using the radial velocity of 5.6 km s−1 (Balona 1982), we found a H I-based distance of ~5000 pc or ~500 pc, similar to the result found by Achmad et al. (1992). This discrepancy is addressed in Sect. 4.3.
o1 Cen. The Gaia DR3 parallax is medium-quality (ϖ/σϖ = 4.43), resulting in a distance of ![Mathematical equation: $\[3783_{-928}^{+3197}\]$](/articles/aa/full_html/2026/04/aa58527-25/aa58527-25-eq99.png) pc. We did not find alignment with any known cluster or OB association. We applied a 0.6 mas yr−1 proper motion cut around o1 Cen’s value on stars within 20′ of the target. We found a population at ~3000 pc with similar proper motion to o1 Cen, no foreground group, but a significant background population at >5000 pc. We calculated a group distance of 2880 ± 100 pc. Using the radial velocity of −21 km s−1 (Gontcharov 2006), we found a H I-based distance of ~2800 pc.
pc. We did not find alignment with any known cluster or OB association. We applied a 0.6 mas yr−1 proper motion cut around o1 Cen’s value on stars within 20′ of the target. We found a population at ~3000 pc with similar proper motion to o1 Cen, no foreground group, but a significant background population at >5000 pc. We calculated a group distance of 2880 ± 100 pc. Using the radial velocity of −21 km s−1 (Gontcharov 2006), we found a H I-based distance of ~2800 pc.
V810 Cen. The Gaia DR3 parallax is low-quality (ϖ/σϖ = 1.7). The star has large proper motion uncertainties (~0.1 mas yr−1) likely due to binarity. It has been identified as a member of the open cluster Stock 14 (Kovtyukh et al. 2010) at a distance of 2340 ± 9 pc (Hunt & Reffert 2024) and also as a background star (Kienzle et al. 1998). On-sky, it is located within the cluster Stock 14. The Hunt & Reffert (2024) catalogue lists two other open clusters in the same sky region: Theia 2727 (![Mathematical equation: $\[3655_{-50}^{+52}\]$](/articles/aa/full_html/2026/04/aa58527-25/aa58527-25-eq100.png) pc) and Lynga 15 (1646 ± 8 pc). The proper motion does not align with any of the clusters. Within a 10′ field of view, we applied a proper motion cut with a radius of 0.4 mas yr−1 around V810Cen and found stellar populations at the distance of Stock 14 and a farther beyond 3000 pc.Kienzle et al. (1998) assumed, based on previous spectroscopic analysis, that the blue companion has a B0-B1 Iab-Ib spectral type and thus an absolute magnitude MV ≃ −6 mag, suggesting a distance greater than 3000 pc. However, in a more recent analysis (Wegner 2006), these supergiant spectral types correspond to −5.22 ≤ MV ≤ −4.65 mag, consistent with MV = −4.6 mag found by Parsons (1981) who assumed a cluster distance of 2600 pc. Another indication of the closer distance is given by interstellar extinction. E(B − V) is in the range of 0.24–0.3 for both Stock 14 and V810Cen (Parsons 1981; Kienzle et al. 1998). Within 10′ of the target we found low extinction for stars at a distance of 2200–2500 pc (monochromatic extinction from Gaia 0.5 ≤ A0 ≤ 1), and much higher extinction for stars at distances of 3000–4000 pc, with A0 increasing from 2 to 4 or even 5. In WISE (Wright et al. 2010) band 3 (12 μm) and band 4 (22 μm) images, a dense structure can be seen at the location of Stock 14, which corresponds to the H II region GAL 295.14–00.63 (Anderson et al. 2014). We extracted the H II number density from the map of Söding et al. (2025) in the line-of-sight towards V810Cen, and found that it increases beyond 2000 pc and peaks at ~2800 pc. This suggests that the H II region lies beyond the cluster Stock 14, causing enhanced extinction for its background stars. Due to the low reddening of V810Cen, it cannot be located within this region and must be part of a closer population. We calculated a group distance of
pc) and Lynga 15 (1646 ± 8 pc). The proper motion does not align with any of the clusters. Within a 10′ field of view, we applied a proper motion cut with a radius of 0.4 mas yr−1 around V810Cen and found stellar populations at the distance of Stock 14 and a farther beyond 3000 pc.Kienzle et al. (1998) assumed, based on previous spectroscopic analysis, that the blue companion has a B0-B1 Iab-Ib spectral type and thus an absolute magnitude MV ≃ −6 mag, suggesting a distance greater than 3000 pc. However, in a more recent analysis (Wegner 2006), these supergiant spectral types correspond to −5.22 ≤ MV ≤ −4.65 mag, consistent with MV = −4.6 mag found by Parsons (1981) who assumed a cluster distance of 2600 pc. Another indication of the closer distance is given by interstellar extinction. E(B − V) is in the range of 0.24–0.3 for both Stock 14 and V810Cen (Parsons 1981; Kienzle et al. 1998). Within 10′ of the target we found low extinction for stars at a distance of 2200–2500 pc (monochromatic extinction from Gaia 0.5 ≤ A0 ≤ 1), and much higher extinction for stars at distances of 3000–4000 pc, with A0 increasing from 2 to 4 or even 5. In WISE (Wright et al. 2010) band 3 (12 μm) and band 4 (22 μm) images, a dense structure can be seen at the location of Stock 14, which corresponds to the H II region GAL 295.14–00.63 (Anderson et al. 2014). We extracted the H II number density from the map of Söding et al. (2025) in the line-of-sight towards V810Cen, and found that it increases beyond 2000 pc and peaks at ~2800 pc. This suggests that the H II region lies beyond the cluster Stock 14, causing enhanced extinction for its background stars. Due to the low reddening of V810Cen, it cannot be located within this region and must be part of a closer population. We calculated a group distance of ![Mathematical equation: $\[2330_{-65}^{+61}\]$](/articles/aa/full_html/2026/04/aa58527-25/aa58527-25-eq101.png) pc for the closer population. We also found a nearby OB association, no. 205 at a distance of 2347 pc Chemel et al. (2022), that overlaps with the Cru OB1 association (Mel’nik & Dambis 2017). The proper motion of the stars in the OB association are a better match for V810Cen than the Stock 14 stars, but most of its members in the Chemel et al. (2022) catalogue are more than 1 deg away on sky. Using the radial velocity of vrad = −17 km s−1 (Kienzle et al. 1998), we found a H I-based distance in the range of 2400–3200 pc.
pc for the closer population. We also found a nearby OB association, no. 205 at a distance of 2347 pc Chemel et al. (2022), that overlaps with the Cru OB1 association (Mel’nik & Dambis 2017). The proper motion of the stars in the OB association are a better match for V810Cen than the Stock 14 stars, but most of its members in the Chemel et al. (2022) catalogue are more than 1 deg away on sky. Using the radial velocity of vrad = −17 km s−1 (Kienzle et al. 1998), we found a H I-based distance in the range of 2400–3200 pc.
HR 5171. The Gaia DR3 parallax is medium-quality (ϖ/σϖ = 4.79), resulting in a distance of ![Mathematical equation: $\[3601_{-539}^{+649}\]$](/articles/aa/full_html/2026/04/aa58527-25/aa58527-25-eq102.png) pc. The YHG HR 5171 has been associated with the star-forming region Gum 48d/R 80 (Karr et al. 2009, and references therein). Its on-sky location and proper motion are not aligned with any known cluster or OB association. We applied a 0.4 mas yr−1 proper motion cut around HR 5171’s value on stars within 10′ of the target. We found a relatively smooth distribution of stellar populations between 2000 and 3500 pc with two population peaks at distances 2300 pc and 2900 pc. Stars at farther distances have high parallax uncertainties, likely due to increased extinction in the H II region Gum 48d (R 80) located at a distance of 2900 pc (Melnik & Dambis 2020) or 3600 pc (Karr et al. 2009). Most stars with proper motions similar to HR 5171 belong to the 2900 pc population. We calculated a group distance of
pc. The YHG HR 5171 has been associated with the star-forming region Gum 48d/R 80 (Karr et al. 2009, and references therein). Its on-sky location and proper motion are not aligned with any known cluster or OB association. We applied a 0.4 mas yr−1 proper motion cut around HR 5171’s value on stars within 10′ of the target. We found a relatively smooth distribution of stellar populations between 2000 and 3500 pc with two population peaks at distances 2300 pc and 2900 pc. Stars at farther distances have high parallax uncertainties, likely due to increased extinction in the H II region Gum 48d (R 80) located at a distance of 2900 pc (Melnik & Dambis 2020) or 3600 pc (Karr et al. 2009). Most stars with proper motions similar to HR 5171 belong to the 2900 pc population. We calculated a group distance of ![Mathematical equation: $\[2953_{-96}^{+92}\]$](/articles/aa/full_html/2026/04/aa58527-25/aa58527-25-eq103.png) pc, which we adopted for HR 5171, but the distance could be higher, as the hot stars with similar proper motions at farther distances are not taken into account because of high parallax uncertainties. The group-based distance of the foreground population is
pc, which we adopted for HR 5171, but the distance could be higher, as the hot stars with similar proper motions at farther distances are not taken into account because of high parallax uncertainties. The group-based distance of the foreground population is ![Mathematical equation: $\[2297_{-65}^{+63}\]$](/articles/aa/full_html/2026/04/aa58527-25/aa58527-25-eq104.png) pc, which could be considered a lower limit for the distance for HR 5171. HR 5171A has a companion HR 5171B, which is a BOIb spectral type supergiant (Humphreys et al. 1971; Karr et al. 2009) with a high-quality parallax value (ϖ/σϖ = 19) and a distance of
pc, which could be considered a lower limit for the distance for HR 5171. HR 5171A has a companion HR 5171B, which is a BOIb spectral type supergiant (Humphreys et al. 1971; Karr et al. 2009) with a high-quality parallax value (ϖ/σϖ = 19) and a distance of ![Mathematical equation: $\[2879_{-134}^{+148}\]$](/articles/aa/full_html/2026/04/aa58527-25/aa58527-25-eq105.png) pc (Bailer-Jones et al. 2021). Using the radial velocity of vrad = 40 km s−1 (Balona 1982; Humphreys et al. 1971), we found a H I-based distance of ~3500 pc (see Fig. 5). Thus, HR 5171 is at a distance of 2900–3600 pc for four reasons: 1) good agreement with H I kinematics and Galactic rotation curve; 2) stellar group at that distance; 3) agreement with the Gaia parallax-based distance of
pc (Bailer-Jones et al. 2021). Using the radial velocity of vrad = 40 km s−1 (Balona 1982; Humphreys et al. 1971), we found a H I-based distance of ~3500 pc (see Fig. 5). Thus, HR 5171 is at a distance of 2900–3600 pc for four reasons: 1) good agreement with H I kinematics and Galactic rotation curve; 2) stellar group at that distance; 3) agreement with the Gaia parallax-based distance of ![Mathematical equation: $\[3601_{-539}^{+649}\]$](/articles/aa/full_html/2026/04/aa58527-25/aa58527-25-eq106.png) (ϖ/σϖ ~ 5; Bailer-Jones et al. 2021; 4) the companion has a similar distance with high-quality quality parallax.
(ϖ/σϖ ~ 5; Bailer-Jones et al. 2021; 4) the companion has a similar distance with high-quality quality parallax.
UCAC2 4867478. The Gaia DR3 parallax is medium-quality (ϖ/σϖ = 6.2), resulting in a distance of ![Mathematical equation: $\[3327_{-331}^{+465}\]$](/articles/aa/full_html/2026/04/aa58527-25/aa58527-25-eq107.png) pc. We did not find alignment with any known cluster or OB association. We applied a 0.2 mas yr−1 proper motion cut around UCAC2 4867478’s value on stars within 10′ of the target. We found a group of hot stars with very similar proper motions and parallaxes. We relaxed the parallax quality criterion to ϖ/σϖ = 3 and calculated a group distance of
pc. We did not find alignment with any known cluster or OB association. We applied a 0.2 mas yr−1 proper motion cut around UCAC2 4867478’s value on stars within 10′ of the target. We found a group of hot stars with very similar proper motions and parallaxes. We relaxed the parallax quality criterion to ϖ/σϖ = 3 and calculated a group distance of ![Mathematical equation: $\[3322_{-314}^{+351}\]$](/articles/aa/full_html/2026/04/aa58527-25/aa58527-25-eq108.png) pc. Using the Gaia DR3 radial velocity of −41 ± 4 km s−1, we found a H I-based distance of ~3600 pc.
pc. Using the Gaia DR3 radial velocity of −41 ± 4 km s−1, we found a H I-based distance of ~3600 pc.
IRAS 14394-6059. The Gaia DR3 parallax is medium-quality (ϖ/σϖ = 5.3, resulting in a distance of ![Mathematical equation: $\[5450_{-686}^{+770}\]$](/articles/aa/full_html/2026/04/aa58527-25/aa58527-25-eq109.png) pc (Bailer-Jones et al. 2021). We did not find alignment with any known cluster or OB association. Within a 10′ field of view, we tried different proper motion cuts and found hot stars scattered over a wide range of distances from 2000 pc to 5000 pc. The parallaxes of distant stars have very high uncertainties and we have no way to disentangle the populations. We are not aware of any radial velocity measurements to derive H I-based distance. If the Gaia parallax is reliable, it is potentially a luminous YSG.
pc (Bailer-Jones et al. 2021). We did not find alignment with any known cluster or OB association. Within a 10′ field of view, we tried different proper motion cuts and found hot stars scattered over a wide range of distances from 2000 pc to 5000 pc. The parallaxes of distant stars have very high uncertainties and we have no way to disentangle the populations. We are not aware of any radial velocity measurements to derive H I-based distance. If the Gaia parallax is reliable, it is potentially a luminous YSG.
CD-59 5594. The Gaia DR3 parallax is high-quality (ϖ/σϖ = 10.33), resulting in a distance of ![Mathematical equation: $\[3739_{-279}^{+325}\]$](/articles/aa/full_html/2026/04/aa58527-25/aa58527-25-eq110.png) pc (Bailer-Jones et al. 2021). The star’s proper motion aligns with the cluster Pismis 21 at a distance of 2906 ± 24 pc (Hunt & Reffert 2024) and with the OB association no. 47 at 2958 pc (Chemel et al. 2022). We applied a 0.15 mas yr−1 proper motion cut around CD-595594’s value on stars within 10′ of the target. We calculated a group distance of 2849 ± 77 pc. Using the Gaia DR3 radial velocity of −36 ± 4 km s−1, we found a H I-based distance of ~2500 pc.
pc (Bailer-Jones et al. 2021). The star’s proper motion aligns with the cluster Pismis 21 at a distance of 2906 ± 24 pc (Hunt & Reffert 2024) and with the OB association no. 47 at 2958 pc (Chemel et al. 2022). We applied a 0.15 mas yr−1 proper motion cut around CD-595594’s value on stars within 10′ of the target. We calculated a group distance of 2849 ± 77 pc. Using the Gaia DR3 radial velocity of −36 ± 4 km s−1, we found a H I-based distance of ~2500 pc.
HD 144812. The Gaia DR3 parallax is high-quality (ϖ/σϖ = 21.55), resulting in a distance of ![Mathematical equation: $\[1352_{-58}^{+66}\]$](/articles/aa/full_html/2026/04/aa58527-25/aa58527-25-eq111.png) pc (Bailer-Jones et al. 2021). However, the RUWE value is high (1.37). Kourniotis et al. (2025) proposed that HD 144812 has a companion of spectral class B2.5 or hotter. The proper motion of HD 144812 does not align with any known cluster or OB association. Within a 10′ field of view, we found very few hot stars. We applied a 0.5 mas yr−1 proper motion cut around HD 144812’s value and found only four stars with Teff > 7500 K: two with distances ~1300 pc and two with distances ~1500 pc. The group-based distance estimate for these four stars is
pc (Bailer-Jones et al. 2021). However, the RUWE value is high (1.37). Kourniotis et al. (2025) proposed that HD 144812 has a companion of spectral class B2.5 or hotter. The proper motion of HD 144812 does not align with any known cluster or OB association. Within a 10′ field of view, we found very few hot stars. We applied a 0.5 mas yr−1 proper motion cut around HD 144812’s value and found only four stars with Teff > 7500 K: two with distances ~1300 pc and two with distances ~1500 pc. The group-based distance estimate for these four stars is ![Mathematical equation: $\[1454_{-51}^{+52}\]$](/articles/aa/full_html/2026/04/aa58527-25/aa58527-25-eq112.png) pc. Increasing the cut radius did not show any farther population with similar kinematics. We are unaware of any radial velocity measurements to calculate a H I-based distance. We explored the effect of the high RUWE value on the distance uncertainty of HD 144812. El-Badry (2025) derived a function that describes the parallax uncertainty inflation factor, f, which takes the higher ruwe values into account. To calculate f, we used the analytic function given in Eq. (3) of El-Badry (2025). In addition to the RUWE value, the inflation factor depends on the parallax itself and an empirical along-scan measurement, ση, which is a function of G-magnitude, (see Sect. 2 in El-Badry et al. 2024, for a detailed description). HD 144812 has G = 7.9 mag, and based on Fig. 3 in Holl et al. (2023), we adopted ση ~ 0.2 mas. We calculated an inflation factor of f = 2.3, resulting in a corrected parallax uncertainty of σϖ = 0.0773. For the parallax itself, we applied the zero-point correction (Lindegren et al. 2021a). The resulting corrected parallax is ϖ = 0.7497 ± 0.0773 mas. Even after inflating the parallax error, ϖ/σϖ = 9.34, indicating a parallax uncertainty of ~10% and confirming that the Gaia parallax of HD 144812 is reasonably reliable. Based on the corrected parallax we derived a geometric distance of
pc. Increasing the cut radius did not show any farther population with similar kinematics. We are unaware of any radial velocity measurements to calculate a H I-based distance. We explored the effect of the high RUWE value on the distance uncertainty of HD 144812. El-Badry (2025) derived a function that describes the parallax uncertainty inflation factor, f, which takes the higher ruwe values into account. To calculate f, we used the analytic function given in Eq. (3) of El-Badry (2025). In addition to the RUWE value, the inflation factor depends on the parallax itself and an empirical along-scan measurement, ση, which is a function of G-magnitude, (see Sect. 2 in El-Badry et al. 2024, for a detailed description). HD 144812 has G = 7.9 mag, and based on Fig. 3 in Holl et al. (2023), we adopted ση ~ 0.2 mas. We calculated an inflation factor of f = 2.3, resulting in a corrected parallax uncertainty of σϖ = 0.0773. For the parallax itself, we applied the zero-point correction (Lindegren et al. 2021a). The resulting corrected parallax is ϖ = 0.7497 ± 0.0773 mas. Even after inflating the parallax error, ϖ/σϖ = 9.34, indicating a parallax uncertainty of ~10% and confirming that the Gaia parallax of HD 144812 is reasonably reliable. Based on the corrected parallax we derived a geometric distance of ![Mathematical equation: $\[1374_{-132}^{+169}\]$](/articles/aa/full_html/2026/04/aa58527-25/aa58527-25-eq113.png) pc, which we adopt for HD 144812.
pc, which we adopt for HD 144812.
V870 Sco. The Gaia DR3 parallax is medium-quality (ϖ/σϖ = 3.87), resulting in a distance of ![Mathematical equation: $\[3945_{-642}^{+940}\]$](/articles/aa/full_html/2026/04/aa58527-25/aa58527-25-eq114.png) pc (Bailer-Jones et al. 2021). On the sky, it is located in the open cluster NGC 6231 (distance 1553 ± 2 pc; Hunt & Reffert 2024), but V870Sco is significantly more reddened than the cluster members (AV ~ 10.0) and has been proposed as a background star (Damiani et al. 2016). This might be a result of an optically thick circumstellar shell or that the star lies behind the cluster, as its radial velocity is different from the cluster members (Robinson et al. 1973; Damiani et al. 2016). Its Gaia proper motion differs by 1.5 mas yr−1 from the cluster members. Detecting a background population is challenging due to the high extinction behind the cluster. We tested 10′ and 20′ fields of view, but the results remain inconclusive. Thus, we are not able to align V870 Sco with any known stellar cluster or association. Using the Gaia DR3 radial velocity of −43 ± 5 km s−1, we found a H I-based distance of ~3500 pc. The radial velocity of −53 km s−1 from Herbig (1972) results in a distance of ~4000 pc, both in agreement with the Bailer-Jones et al. (2021) distance.
pc (Bailer-Jones et al. 2021). On the sky, it is located in the open cluster NGC 6231 (distance 1553 ± 2 pc; Hunt & Reffert 2024), but V870Sco is significantly more reddened than the cluster members (AV ~ 10.0) and has been proposed as a background star (Damiani et al. 2016). This might be a result of an optically thick circumstellar shell or that the star lies behind the cluster, as its radial velocity is different from the cluster members (Robinson et al. 1973; Damiani et al. 2016). Its Gaia proper motion differs by 1.5 mas yr−1 from the cluster members. Detecting a background population is challenging due to the high extinction behind the cluster. We tested 10′ and 20′ fields of view, but the results remain inconclusive. Thus, we are not able to align V870 Sco with any known stellar cluster or association. Using the Gaia DR3 radial velocity of −43 ± 5 km s−1, we found a H I-based distance of ~3500 pc. The radial velocity of −53 km s−1 from Herbig (1972) results in a distance of ~4000 pc, both in agreement with the Bailer-Jones et al. (2021) distance.
V915 Sco. The Gaia DR3 parallax is high-quality (ϖ/σϖ = 10.44), resulting in a distance of ![Mathematical equation: $\[1809_{-182}^{+191}\]$](/articles/aa/full_html/2026/04/aa58527-25/aa58527-25-eq115.png) pc (Bailer-Jones et al. 2021). V915 Sco is a luminous YSG (HD 155603A) with a Wolf-Rayet WN companion WR 85 (HD 155603B; Andrews 1977). On the sky, it is located in the open cluster HSC 2870 at a distance of 2350 ± 25 pc (Hunt & Reffert 2024) and its proper motion aligns with it (1σ). The proper motion also aligns with the OB association no. 82 at a distance of 2250 pc (Chemel et al. 2022). We applied a 0.2 mas yr−1 proper motion cut around V915 Sco’s value on stars within 10′ of the target. We calculated a group distance of
pc (Bailer-Jones et al. 2021). V915 Sco is a luminous YSG (HD 155603A) with a Wolf-Rayet WN companion WR 85 (HD 155603B; Andrews 1977). On the sky, it is located in the open cluster HSC 2870 at a distance of 2350 ± 25 pc (Hunt & Reffert 2024) and its proper motion aligns with it (1σ). The proper motion also aligns with the OB association no. 82 at a distance of 2250 pc (Chemel et al. 2022). We applied a 0.2 mas yr−1 proper motion cut around V915 Sco’s value on stars within 10′ of the target. We calculated a group distance of ![Mathematical equation: $\[2253_{-56}^{+57}\]$](/articles/aa/full_html/2026/04/aa58527-25/aa58527-25-eq116.png) pc. Using the radial velocity of −6 km s−1 (Andrews 1977), we found a H I-based distance in the range of 1200–2000 pc.
pc. Using the radial velocity of −6 km s−1 (Andrews 1977), we found a H I-based distance in the range of 1200–2000 pc.
IRAS 17163-3907. The Gaia DR3 parallax is low-quality (ϖ/σϖ = 1.95). According to literature, IRAS 17163-3907 could be a member of the star forming region RCW 122 at a distance of ![Mathematical equation: $\[3380_{-270}^{+330}\]$](/articles/aa/full_html/2026/04/aa58527-25/aa58527-25-eq117.png) pc (Wu et al. 2012) or 5000 pc (Arnal et al. 2008). The radial velocity of the molecular cloud has been measured at vLSR = −15 km s−1, where gas with velocity from −23 to −8 km s−1 is expected to be physically associated (Arnal et al. 2008). These values differ from the star’s systemic velocity vLSR = 18 km s−1 (Wallström et al. 2017). Calculations using luminosity and the star’s high visual extinction suggest a 1000 pc distance (Wallström et al. 2015) and the distance derived from Gaia DR2 parallax,
pc (Wu et al. 2012) or 5000 pc (Arnal et al. 2008). The radial velocity of the molecular cloud has been measured at vLSR = −15 km s−1, where gas with velocity from −23 to −8 km s−1 is expected to be physically associated (Arnal et al. 2008). These values differ from the star’s systemic velocity vLSR = 18 km s−1 (Wallström et al. 2017). Calculations using luminosity and the star’s high visual extinction suggest a 1000 pc distance (Wallström et al. 2015) and the distance derived from Gaia DR2 parallax, ![Mathematical equation: $\[1200_{-200}^{+400}\]$](/articles/aa/full_html/2026/04/aa58527-25/aa58527-25-eq118.png) pc, has been used by Koumpia et al. (2020). A distance between 3600 pc and 4700 pc was suggested by Lagadec et al. (2011). We found no alignment with any known stellar cluster or OB association, but note that due to the high extinction in this region, any stars farther than 3000 pc could be too faint for reliable parallaxes. Using the vLSR = 18 km s−1 (Wallström et al. 2017) and an LSR correction of ~8 km s−1, we found a H I-based distance of ~1000 pc (see Fig. 5).
pc, has been used by Koumpia et al. (2020). A distance between 3600 pc and 4700 pc was suggested by Lagadec et al. (2011). We found no alignment with any known stellar cluster or OB association, but note that due to the high extinction in this region, any stars farther than 3000 pc could be too faint for reliable parallaxes. Using the vLSR = 18 km s−1 (Wallström et al. 2017) and an LSR correction of ~8 km s−1, we found a H I-based distance of ~1000 pc (see Fig. 5).
V925 Sco. The Gaia DR3 parallax is high-quality (ϖ/σϖ = 12.76), resulting in a distance of ![Mathematical equation: $\[3006_{-166}^{+192}\]$](/articles/aa/full_html/2026/04/aa58527-25/aa58527-25-eq119.png) pc. It has been identified as a member of Trumpler 27 (Moffat et al. 1977), although this cluster might be a collection of stellar populations extending from 1500 to 5000 pc rather than a compact group (Perren et al. 2012). In the open cluster catalogue of Hunt & Reffert (2024), there are two clusters in roughly the same sky region at different distances: OC 697 (ϖ = 0.397 ± 0.045 mas, distance 2282 ± 12 pc) and UFMG 82 (ϖ = 0.59 ± 0.05 mas, distance 1550 ± 9 pc), both have Tr 27 as an alternate designation. We were unable to find reliable radial velocities for the clusters. This could offer an explanation for the uncertain distance of Tr 27 with results from different authors varying from 1000 to 2000 pc (Moffat et al. 1977). The proper motion of V925 Sco does not align with the members of either of these open clusters. It is in slightly better alignment with association no. 82, at a distance of 2250 pc Chemel et al. (2022), close to OC 697. We applied a 0.3 mas yr−1 proper motion cut around V925 Sco’s value on stars within 10′ of the target. We found stellar groups at two distances: at
pc. It has been identified as a member of Trumpler 27 (Moffat et al. 1977), although this cluster might be a collection of stellar populations extending from 1500 to 5000 pc rather than a compact group (Perren et al. 2012). In the open cluster catalogue of Hunt & Reffert (2024), there are two clusters in roughly the same sky region at different distances: OC 697 (ϖ = 0.397 ± 0.045 mas, distance 2282 ± 12 pc) and UFMG 82 (ϖ = 0.59 ± 0.05 mas, distance 1550 ± 9 pc), both have Tr 27 as an alternate designation. We were unable to find reliable radial velocities for the clusters. This could offer an explanation for the uncertain distance of Tr 27 with results from different authors varying from 1000 to 2000 pc (Moffat et al. 1977). The proper motion of V925 Sco does not align with the members of either of these open clusters. It is in slightly better alignment with association no. 82, at a distance of 2250 pc Chemel et al. (2022), close to OC 697. We applied a 0.3 mas yr−1 proper motion cut around V925 Sco’s value on stars within 10′ of the target. We found stellar groups at two distances: at ![Mathematical equation: $\[2310_{-110}^{+126}\]$](/articles/aa/full_html/2026/04/aa58527-25/aa58527-25-eq120.png) pc, the neighbourhood of OC 697, and at
pc, the neighbourhood of OC 697, and at ![Mathematical equation: $\[3110_{-298}^{+359}\]$](/articles/aa/full_html/2026/04/aa58527-25/aa58527-25-eq121.png) pc, a more distant population. V925 Sco could belong to either population, but due to the proper motion similarity with the OB association we list the closer distance in Table A.1. Using the Gaia DR3 radial velocity of −15.6 km s−1, we found a H I-based distance in the range of 1800 to 4000 pc. Because we are looking in the direction of the Galactic centre, the H I velocity profile is rather flat around −12 km s−1 over a wide distance range.
pc, a more distant population. V925 Sco could belong to either population, but due to the proper motion similarity with the OB association we list the closer distance in Table A.1. Using the Gaia DR3 radial velocity of −15.6 km s−1, we found a H I-based distance in the range of 1800 to 4000 pc. Because we are looking in the direction of the Galactic centre, the H I velocity profile is rather flat around −12 km s−1 over a wide distance range.
[FMR2006] 15. The Gaia DR3 parallax is low-quality (ϖ/σϖ = 1.23). This star is a member of the Red Supergiant Cluster 1 (RSGC 1) at a large distance of 5800 pc (Figer et al. 2006) or 6600 ± 890 pc (Davies et al. 2008). It is too distant to reliably detect a stellar group of hot stars. Using the radial velocity of vLSR = 120.8 km s−1 (Davies et al. 2008) with an LSR correction of 15 km s−1, we found a H I-based distance of ~6500 pc.
IRAS 18357-0604. The Gaia DR3 parallax is negative. This star has a very similar proper motion to nearby supergiants belonging to the cluster RSGC 2, at a distance of ![Mathematical equation: $\[5830_{-780}^{1910}\]$](/articles/aa/full_html/2026/04/aa58527-25/aa58527-25-eq122.png) pc (Davies et al. 2007). Using the radial velocity of 90 ± 3 km s−1 (Clark et al. 2014), we found a H I-based distance of 5500 pc.
pc (Davies et al. 2007). Using the radial velocity of 90 ± 3 km s−1 (Clark et al. 2014), we found a H I-based distance of 5500 pc.
HD 179821. The Gaia DR3 parallax is high-quality (ϖ/σϖ = 9.2), resulting in a distance of ![Mathematical equation: $\[4432_{-355}^{+349}\]$](/articles/aa/full_html/2026/04/aa58527-25/aa58527-25-eq123.png) pc (Bailer-Jones et al. 2021). We found no alignment with any known cluster or OB association, but the star may be too distant. Using the radial velocity of 85.8 ± 0.8 km s−1 (Şahin et al. 2016), we found a H I-based distance of >5000 pc.
pc (Bailer-Jones et al. 2021). We found no alignment with any known cluster or OB association, but the star may be too distant. Using the radial velocity of 85.8 ± 0.8 km s−1 (Şahin et al. 2016), we found a H I-based distance of >5000 pc.
V1452 Aql. The Gaia DR3 parallax is high-quality (ϖ/σϖ = 15.5), resulting in a distance of ![Mathematical equation: $\[2748_{-148}^{+193}\]$](/articles/aa/full_html/2026/04/aa58527-25/aa58527-25-eq124.png) pc (Bailer-Jones et al. 2021). This star has been identified as a member of the open cluster CWNU 1591 (He et al. 2023b). We applied a 0.25 mas yr−1 proper motion cut around V1452 Aql’s value on stars within 10′ of the target. We calculated a group distance of
pc (Bailer-Jones et al. 2021). This star has been identified as a member of the open cluster CWNU 1591 (He et al. 2023b). We applied a 0.25 mas yr−1 proper motion cut around V1452 Aql’s value on stars within 10′ of the target. We calculated a group distance of ![Mathematical equation: $\[2472_{-104}^{+111}\]$](/articles/aa/full_html/2026/04/aa58527-25/aa58527-25-eq125.png) pc. Using the Gaia DR3 radial velocity of 33 ± 8 km s−1, we found a H I-based distance in the range of 2500–3500 pc.
pc. Using the Gaia DR3 radial velocity of 33 ± 8 km s−1, we found a H I-based distance in the range of 2500–3500 pc.
IRC +10420. The Gaia DR3 parallax is medium-quality (ϖ/σϖ = 3.43), resulting in a distance of ![Mathematical equation: $\[4260_{-752}^{+878}\]$](/articles/aa/full_html/2026/04/aa58527-25/aa58527-25-eq126.png) pc. We did not found alignment with any known cluster or OB association, but the star may be too distant. Using the radial velocity of ~60 km s−1 (Klochkova et al. 1997; Jones et al. 1993; Oudmaijer et al. 1996), we found a H I-based distance of ~5500 pc. This is in agreement with previous distance estimates in the range of 4000–6000 pc (Jones et al. 1993; Reddy & Hrivnak 1999).
pc. We did not found alignment with any known cluster or OB association, but the star may be too distant. Using the radial velocity of ~60 km s−1 (Klochkova et al. 1997; Jones et al. 1993; Oudmaijer et al. 1996), we found a H I-based distance of ~5500 pc. This is in agreement with previous distance estimates in the range of 4000–6000 pc (Jones et al. 1993; Reddy & Hrivnak 1999).
V1027 Cyg. The Gaia DR3 parallax is is high-quality (ϖ/σϖ = 13.45), resulting in a distance of ![Mathematical equation: $\[3723_{-237}^{+265}\]$](/articles/aa/full_html/2026/04/aa58527-25/aa58527-25-eq127.png) pc. The star’s proper motion aligns with the OB association no. 15 at a distance of 3902 pc (Chemel et al. 2022). We applied a 0.1 mas yr−1 proper motion cut around V 1027 Cyg’s value on stars within 10′ of the target. We calculated a group distance of
pc. The star’s proper motion aligns with the OB association no. 15 at a distance of 3902 pc (Chemel et al. 2022). We applied a 0.1 mas yr−1 proper motion cut around V 1027 Cyg’s value on stars within 10′ of the target. We calculated a group distance of ![Mathematical equation: $\[3977_{-208}^{+226}\]$](/articles/aa/full_html/2026/04/aa58527-25/aa58527-25-eq128.png) pc. Using the Gaia DR3 radial velocity of 8.7 ± 10.3 km s−1, we found a H I-based distance in a very wide range of 2000–4500 pc.
pc. Using the Gaia DR3 radial velocity of 8.7 ± 10.3 km s−1, we found a H I-based distance in a very wide range of 2000–4500 pc.
HD 331777. The Gaia DR3 parallax is high-quality (ϖ/σϖ = 11.58), resulting in a distance of ![Mathematical equation: $\[4559_{-363}^{+388}\]$](/articles/aa/full_html/2026/04/aa58527-25/aa58527-25-eq129.png) pc. On the sky, the star is located within the open cluster Kronberger 54 at a distance of
pc. On the sky, the star is located within the open cluster Kronberger 54 at a distance of ![Mathematical equation: $\[4025_{-70}^{+73}\]$](/articles/aa/full_html/2026/04/aa58527-25/aa58527-25-eq130.png) pc (Hunt & Reffert 2024) and its proper motion aligns with cluster members within 3σ. Its proper motion also aligns with members of the OB association no. 15 at a distance of 3902 pc (Chemel et al. 2022). We applied a 0.25 mas yr−1 proper motion cut around HD 331777’s value on stars within 10′ of the target. We calculated a group distance of
pc (Hunt & Reffert 2024) and its proper motion aligns with cluster members within 3σ. Its proper motion also aligns with members of the OB association no. 15 at a distance of 3902 pc (Chemel et al. 2022). We applied a 0.25 mas yr−1 proper motion cut around HD 331777’s value on stars within 10′ of the target. We calculated a group distance of ![Mathematical equation: $\[3789_{-176}^{+190}\]$](/articles/aa/full_html/2026/04/aa58527-25/aa58527-25-eq131.png) pc. Using the Gaia DR3 radial velocity of 0.8 ± 5.5 km s−1, we found a H I-based distance in a very wide range of 2000–5000 pc.
pc. Using the Gaia DR3 radial velocity of 0.8 ± 5.5 km s−1, we found a H I-based distance in a very wide range of 2000–5000 pc.
RW Cep. The Gaia DR3 parallax is medium-quality (ϖ/σϖ = 3.33), resulting in a distance of ![Mathematical equation: $\[6666_{-1006}^{+1561}\]$](/articles/aa/full_html/2026/04/aa58527-25/aa58527-25-eq132.png) pc. The star’s proper motion aligns with the open cluster Berkeley 94 at a distance of 4000 ± 40 pc (Hunt & Reffert 2024) within 3σ and it has been identified as a cluster member (Delgado et al. 2013) or a member of the Cep OB1 association (Humphreys 1978). Its proper motion aligns with the OB association no. 122 (Chemel et al. 2022) at a distance of 3876 pc. We applied a 0.1 mas yr−1 proper motion cut around RW Cep’s value on stars within 10′ of the target. We calculated a group distance of
pc. The star’s proper motion aligns with the open cluster Berkeley 94 at a distance of 4000 ± 40 pc (Hunt & Reffert 2024) within 3σ and it has been identified as a cluster member (Delgado et al. 2013) or a member of the Cep OB1 association (Humphreys 1978). Its proper motion aligns with the OB association no. 122 (Chemel et al. 2022) at a distance of 3876 pc. We applied a 0.1 mas yr−1 proper motion cut around RW Cep’s value on stars within 10′ of the target. We calculated a group distance of ![Mathematical equation: $\[3921_{-157}^{+168}\]$](/articles/aa/full_html/2026/04/aa58527-25/aa58527-25-eq133.png) pc. Using the radial velocity of −50 ± 3 km s−1 (Kasikov et al. 2025), we found a H I-based distance of ~3500 pc.
pc. Using the radial velocity of −50 ± 3 km s−1 (Kasikov et al. 2025), we found a H I-based distance of ~3500 pc.
V509 Cas. The Gaia DR3 parallax is medium-quality (ϖ/σϖ = 3.96), resulting in a distance of ![Mathematical equation: $\[3917_{-737}^{+969}\]$](/articles/aa/full_html/2026/04/aa58527-25/aa58527-25-eq134.png) pc. It has been identified as a member of Cep OB1 association (Mel’nik & Dambis 2017; Humphreys 1978). Its proper motion aligns with OB association no. 120 at a distance of 3055 pc (Chemel et al. 2022), which has proper motions consistent with the Cep OB1 association (Mel’nik & Dambis 2017). We applied a 0.4 mas yr−1 proper motion cut around V509 Cas’ value on stars within 10′ of the target. We calculated a group distance of 3368 ± 127 pc. This distance is about 2.5 times larger than the distance of
pc. It has been identified as a member of Cep OB1 association (Mel’nik & Dambis 2017; Humphreys 1978). Its proper motion aligns with OB association no. 120 at a distance of 3055 pc (Chemel et al. 2022), which has proper motions consistent with the Cep OB1 association (Mel’nik & Dambis 2017). We applied a 0.4 mas yr−1 proper motion cut around V509 Cas’ value on stars within 10′ of the target. We calculated a group distance of 3368 ± 127 pc. This distance is about 2.5 times larger than the distance of ![Mathematical equation: $\[1370_{-398}^{+561}\]$](/articles/aa/full_html/2026/04/aa58527-25/aa58527-25-eq135.png) from the HIPPARCOS parallax used by Nieuwenhuijzen et al. (2012). Using the radial velocity of −60.7 km s−1 (Kasikov et al. 2024), we found a H I-based distance of ~3800 pc.
from the HIPPARCOS parallax used by Nieuwenhuijzen et al. (2012). Using the radial velocity of −60.7 km s−1 (Kasikov et al. 2024), we found a H I-based distance of ~3800 pc.
6 Cas. The group distance determination for 6 Cas is given in detail in Sect. 3.2. Using the Gaia DR3 radial velocity of −43 ± 8 km s−1, we found a H I-based distance in the range of 2000–3000 pc.
HD 223767. The Gaia DR3 parallax is high-quality (ϖ/σϖ = 20.17), resulting in a distance of ![Mathematical equation: $\[2879_{-117}^{+136}\]$](/articles/aa/full_html/2026/04/aa58527-25/aa58527-25-eq136.png) pc (Bailer-Jones et al. 2021). It has been identified as a member of Cas OB5 association (Mel’nik & Dambis 2017; Quintana et al. 2025). On the sky, the star is very close to the open cluster King 12 (distance 2805 ± 19 pc; Hunt & Reffert 2024), but its proper motion is slightly outside of the 3σ radius. Its proper motion aligns with the OB association no. 141 at a distance of distance 2827 pc (Chemel et al. 2022). We applied a 0.2 mas yr−1 proper motion cut around HD 223767’s value on stars within 10′ of the target. We calculated a group distance of
pc (Bailer-Jones et al. 2021). It has been identified as a member of Cas OB5 association (Mel’nik & Dambis 2017; Quintana et al. 2025). On the sky, the star is very close to the open cluster King 12 (distance 2805 ± 19 pc; Hunt & Reffert 2024), but its proper motion is slightly outside of the 3σ radius. Its proper motion aligns with the OB association no. 141 at a distance of distance 2827 pc (Chemel et al. 2022). We applied a 0.2 mas yr−1 proper motion cut around HD 223767’s value on stars within 10′ of the target. We calculated a group distance of ![Mathematical equation: $\[2740_{-83}^{+86}\]$](/articles/aa/full_html/2026/04/aa58527-25/aa58527-25-eq137.png) pc. Using the Gaia DR3 radial velocity of −41 ± 2 km s−1, we found a H I-based distance in the range of 2000–3000 pc.
pc. Using the Gaia DR3 radial velocity of −41 ± 2 km s−1, we found a H I-based distance in the range of 2000–3000 pc.
ρ Cas. The Gaia DR3 parallax is negative. The star has been identified as a member of the Cas OB5 association (Mel’nik & Dambis 2017). However, we found that the proper motions of the association members differ by ~1 mas−1 and the association is located >2 deg away on the sky. We did not find alignment with any known cluster or OB association. We applied a 1 mas yr−1 proper motion cut around ρ Cas’ value on stars within 20′ of the target. As there are very few hot stars in the region, we included cooler stars down to 7000 K. Among stars with similar proper motions appear two distinct groups: six stars at 1700–2100 pc (Gaia parallaxes between 0.47 and 0.54) and 17 stars at 2500–3500 pc (parallaxes between 0.27 and 0.38). The second group includes three stars with Teff> 8000 K, all other stars in both groups are cooler. For estimating the distance of ρ Cas, we used the mean parallax of the second group. We calculated a group distance of ![Mathematical equation: $\[2810_{-102}^{+104}\]$](/articles/aa/full_html/2026/04/aa58527-25/aa58527-25-eq138.png) pc. Using the radial velocity of −47 ± 2 km s−1 (Lobel et al. 2003), we found a H I-based distance in the range of 2500–3200 pc, in agreement with the distance to the farther stellar group.
pc. Using the radial velocity of −47 ± 2 km s−1 (Lobel et al. 2003), we found a H I-based distance in the range of 2500–3200 pc, in agreement with the distance to the farther stellar group.
Appendix C Proper motion cuts for group distance determination
 |
Fig. C.1 Selection of hot stars around each sample YHG or YSG based on proper motion criteria. The YHG or YSG is in the centre with error bars. The red dashed circle marks the proper motion cut radius. Stars shown as orange circles meet the selection criteria from Sect. 3. Stars used for calculating the group distance are marked with black crosses. |
Appendix D Stars selected for group distance determination
Stars selected for the group-based distance calculation.
Appendix E Radial velocities
Radial velocities compiled from the literature.
Appendix F Luminosities
Literature data (Lit. columns) and derived radii and luminosities for the sample stars.
All Tables
Literature data (Lit. columns) and derived radii and luminosities for the sample stars.
All Figures
|
Fig. 1 Sky region around 6 Cas (red cross). Top panel: projected offsets on sky. Bottom panel: proper motions. Field stars from Gaia are marked in grey (one in ten is plotted), open clusters from Hunt & Reffert (2024) are marked in coloured points, members of the OB associations Cas OB5 from Mel’nik & Dambis (2017) and no. 141 (Chemel et al. 2022) are marked with open symbols (some members overlap between the two catalogues). The arrows in the top panel indicate the motion of cluster and OB association stars over the past 0.1 Myr based on their proper motions. |
| In the text | |
|
Fig. 2 Gaia effective temperatures and Bailer-Jones et al. (2021) distances for hot stars within 10′ of 6 Cas. Stars meeting our astrometric quality criteria are highlighted in orange. The final selection of stars used for the distance estimation is marked with black crosses. |
| In the text | |
|
Fig. 3 Selection of stars near 6 Cas (red cross) based on proper motion, using the same sample as in Fig. 2. The proper motion cut with a radius of 0.2 mas yr−1 is marked with a red circle. |
| In the text | |
|
Fig. 4 Comparison of group-based distances derived in this work with distances derived from Gaia parallaxes by Bailer-Jones et al. (2021). Stars associated with clusters, OB association, and stars without an origin group are marked with different symbols and colours. The dashed grey line marks the one-to-one relation. Outliers are marked. Both axes are logarithmic. |
| In the text | |
|
Fig. 5 Radial velocity of H I gas along the lines of sight towards six YHGs. The thin blue lines show the sampled posterior velocity distribution of H I at each distance bin within a 0.5 deg region around each star. The solid black line indicates the mean velocity. The horizontal red lines mark the observed stellar radial velocity, and the shaded region shows the approximate variability amplitude. |
| In the text | |
|
Fig. 6 Comparison of group-based and H I-based distances. The solid lines indicate the H I-based distance ranges, and the lighter lines illustrate the uncertainties. Affiliations with stellar groups are indicated with different colours as in Fig. 4. The dashed grey line marks the one-to-one relation. |
| In the text | |
|
Fig. 7 Stellar radii vs. Teff. The YHGs are labelled, and dashed grey lines indicate constant-luminosity tracks at the indicated log L/L⊙ values (50 000, 100 000, 200 000, and 500 000 L⊙.) |
| In the text | |
|
Fig. 8 Yellow hypergiants and YSGs on the HR diagram. YHGs are shown as filled yellow circles, and YSGs and candidate YHGs are shown as empty yellow circles. Literature values for four YHGs are shown as grey circles. The HD luminosity limit (Humphreys 1978) is marked with a dashed line. Solar metallicity evolutionary tracks (Ekström et al. 2012) are shown as dotted light grey lines. Top panel: yellow hypergiants and YSGs only. Bottom panel: literature data for Galactic RSGs (red squares; Healy et al. 2024), LBVs (cyan diamonds; Smith et al. 2019), and B[e] Supergiant stars (blue triangles; Miroshnichenko et al. 2025) are shown for comparison. |
| In the text | |
|
Fig. 9 Family portrait. Illustration of the Milky Way4 showing the distribution of YSGs (circles) and YHGs (stars). Objects with group-based distances are marked with filled markers, and objects with distances based on H I or Bailer-Jones et al. (2021) are marked with empty markers. |
| In the text | |
|
Fig. C.1 Selection of hot stars around each sample YHG or YSG based on proper motion criteria. The YHG or YSG is in the centre with error bars. The red dashed circle marks the proper motion cut radius. Stars shown as orange circles meet the selection criteria from Sect. 3. Stars used for calculating the group distance are marked with black crosses. |
| In the text | |
Current usage metrics show cumulative count of Article Views (full-text article views including HTML views, PDF and ePub downloads, according to the available data) and Abstracts Views on Vision4Press platform.
Data correspond to usage on the plateform after 2015. The current usage metrics is available 48-96 hours after online publication and is updated daily on week days.
Initial download of the metrics may take a while.