Fig. 6.
Download original image
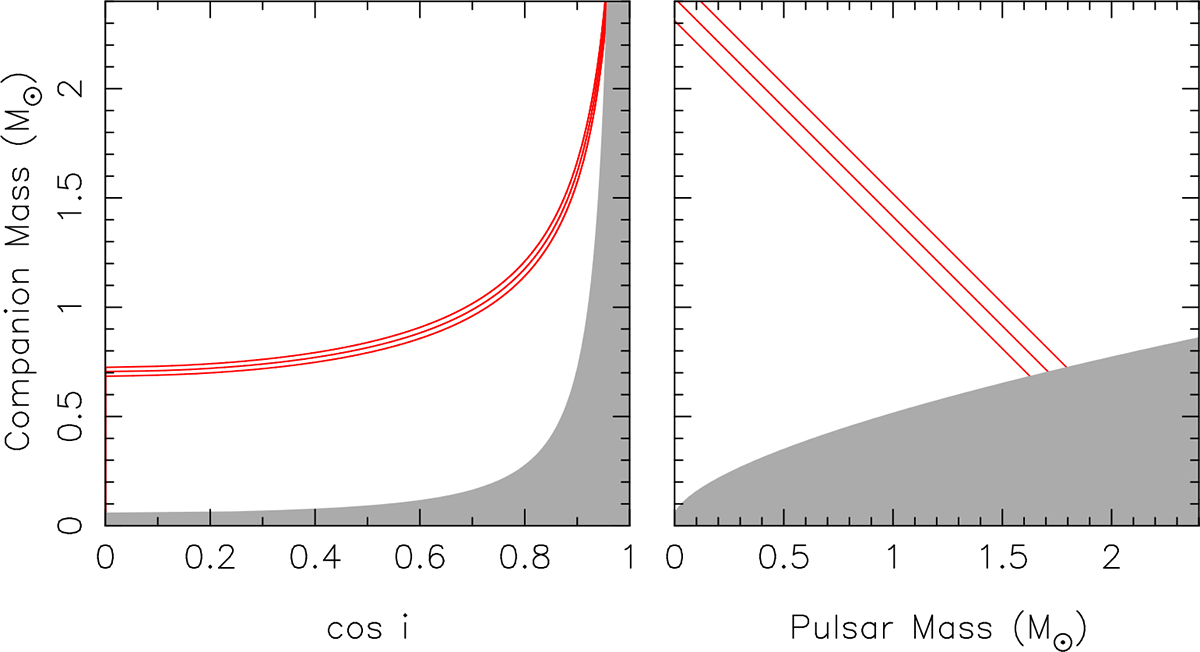
Mass-mass diagram of 47 Tuc ai. The plot on the left shows Mc as a function of cos i, while i is the inclination of the system. The plot on the right shows Mc as a function of Mp. The grey region in the left plot is excluded, as it implies negative Mp. For the plot on the right, the grey region is excluded by the mass function and the constraint that sin i ≤ 1. The red lines in both the plots show nominal values and the total mass derived from ![]() deg yr−1 (see Sect. 3.5). From these, we inferred that Mtot = 2.41 ± 0.11 M⊙, Mc, min ≥ 0.7 M⊙, and Mp, max ≤ 1.7 M⊙.
deg yr−1 (see Sect. 3.5). From these, we inferred that Mtot = 2.41 ± 0.11 M⊙, Mc, min ≥ 0.7 M⊙, and Mp, max ≤ 1.7 M⊙.
Current usage metrics show cumulative count of Article Views (full-text article views including HTML views, PDF and ePub downloads, according to the available data) and Abstracts Views on Vision4Press platform.
Data correspond to usage on the plateform after 2015. The current usage metrics is available 48-96 hours after online publication and is updated daily on week days.
Initial download of the metrics may take a while.