Fig. 7.
Download original image
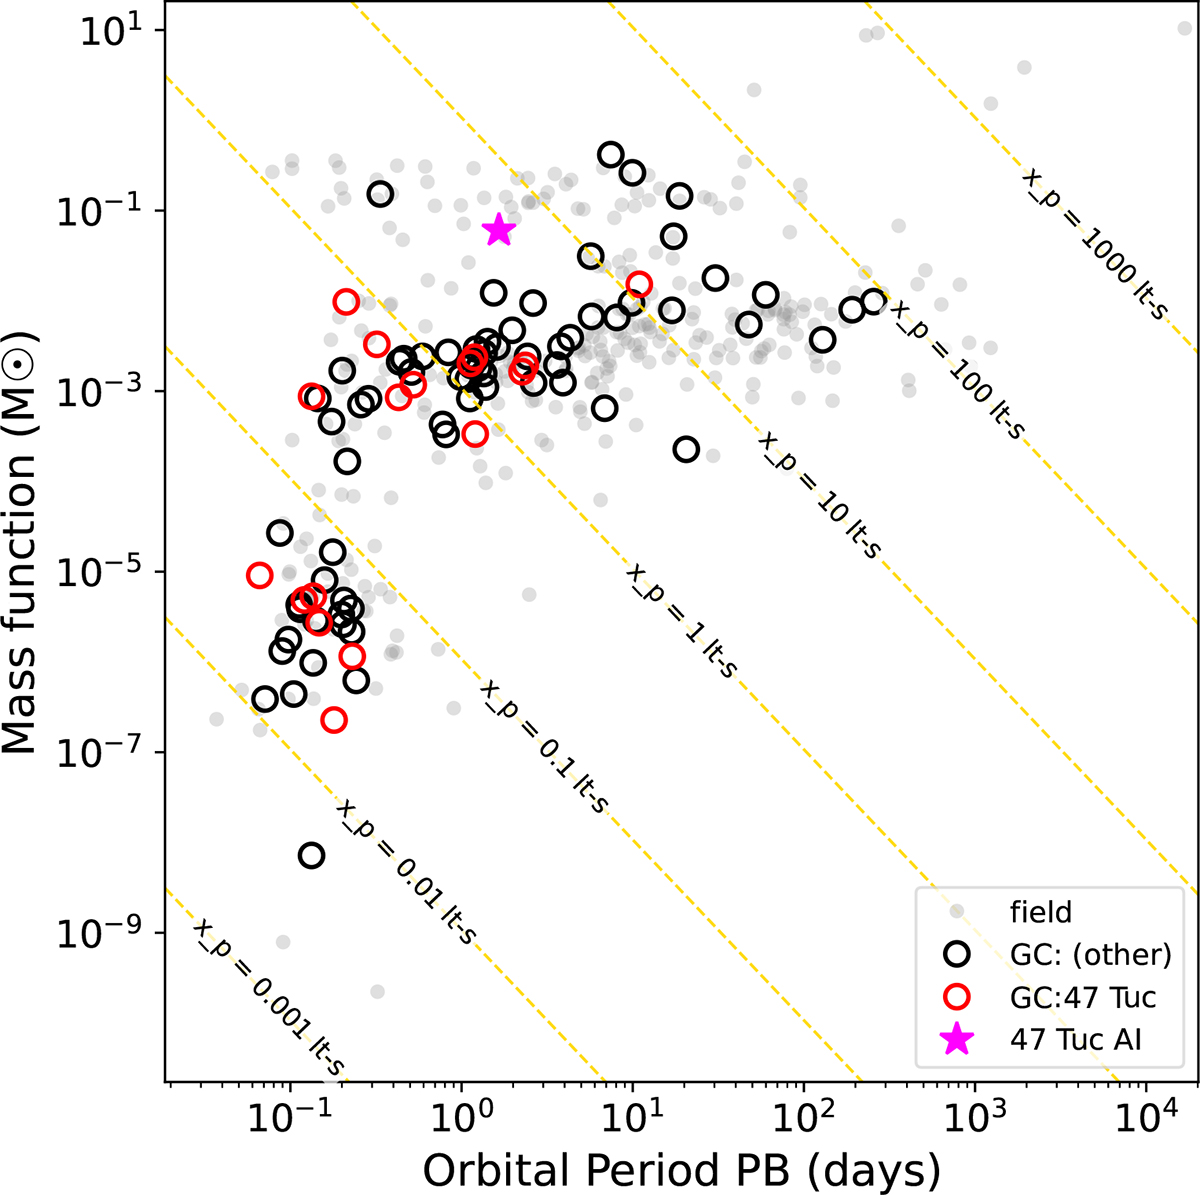
Mass function plotted against the orbital period for all the binary pulsars from the ATNF pulsar catalogue (https://www.atnf.csiro.au/research/pulsar/psrcat/) (Manchester et al. 2005). The binary pulsars in the Galactic field are shown with filled grey dots, while the pulsars in GC are circles. Pulsars in GC 47 Tuc are in red, and those in other GCs are shown with black circles. The inclined dotted yellow lines represent the constant projected semi-major axis of the binary orbit, which is smallest at the lower-left side: x = 1 lt-millisecond. From the bottom left to the top right, the successive dotted yellow lines are an order of magnitude greater than the previous one. The magenta coloured star symbol represents the 47 Tuc ai system.
Current usage metrics show cumulative count of Article Views (full-text article views including HTML views, PDF and ePub downloads, according to the available data) and Abstracts Views on Vision4Press platform.
Data correspond to usage on the plateform after 2015. The current usage metrics is available 48-96 hours after online publication and is updated daily on week days.
Initial download of the metrics may take a while.