Fig. 6
Download original image
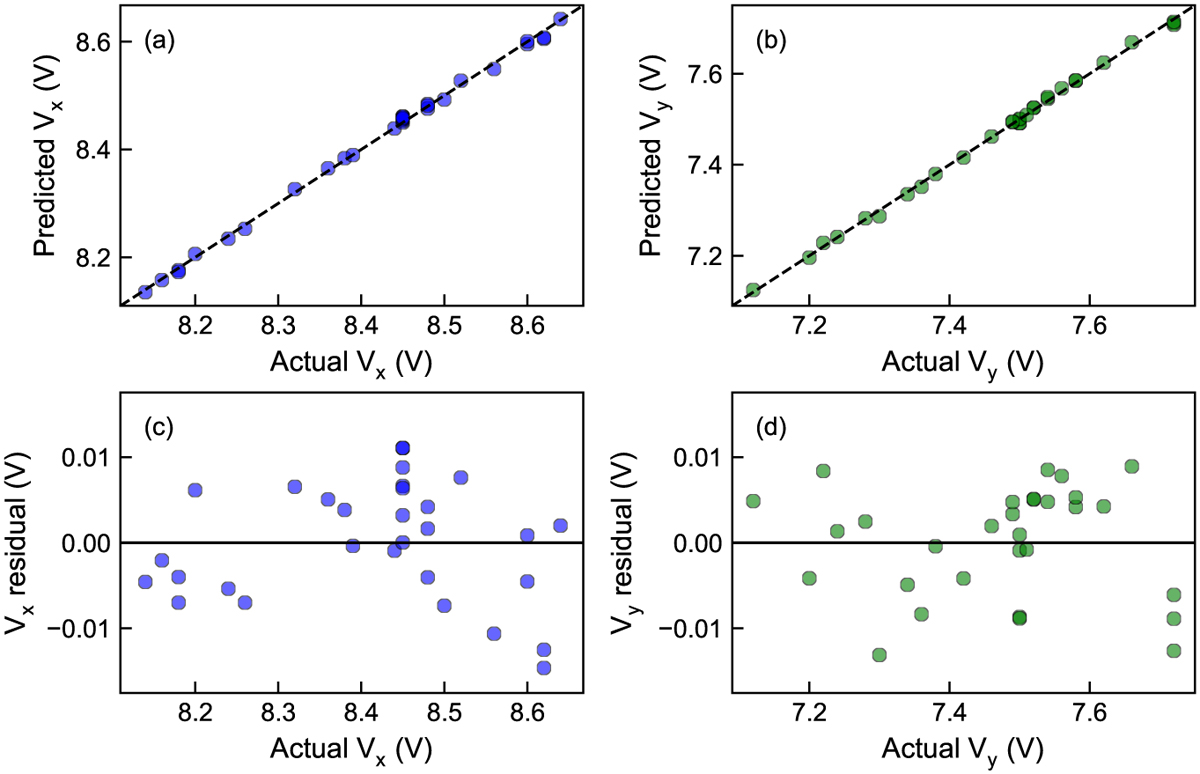
Accuracy validation of the response model. (a) Predicted versus actual voltage for the Vx. The dashed line indicates the 1:1 line. blue spots for Vx, green spots for Vy. (b) Predicted versus actual voltage for the Vy. (c) Distribution of residuals between predicted and actual Vx values. (d) Distribution of residuals between predicted and actual Vy values.
Current usage metrics show cumulative count of Article Views (full-text article views including HTML views, PDF and ePub downloads, according to the available data) and Abstracts Views on Vision4Press platform.
Data correspond to usage on the plateform after 2015. The current usage metrics is available 48-96 hours after online publication and is updated daily on week days.
Initial download of the metrics may take a while.