Open Access
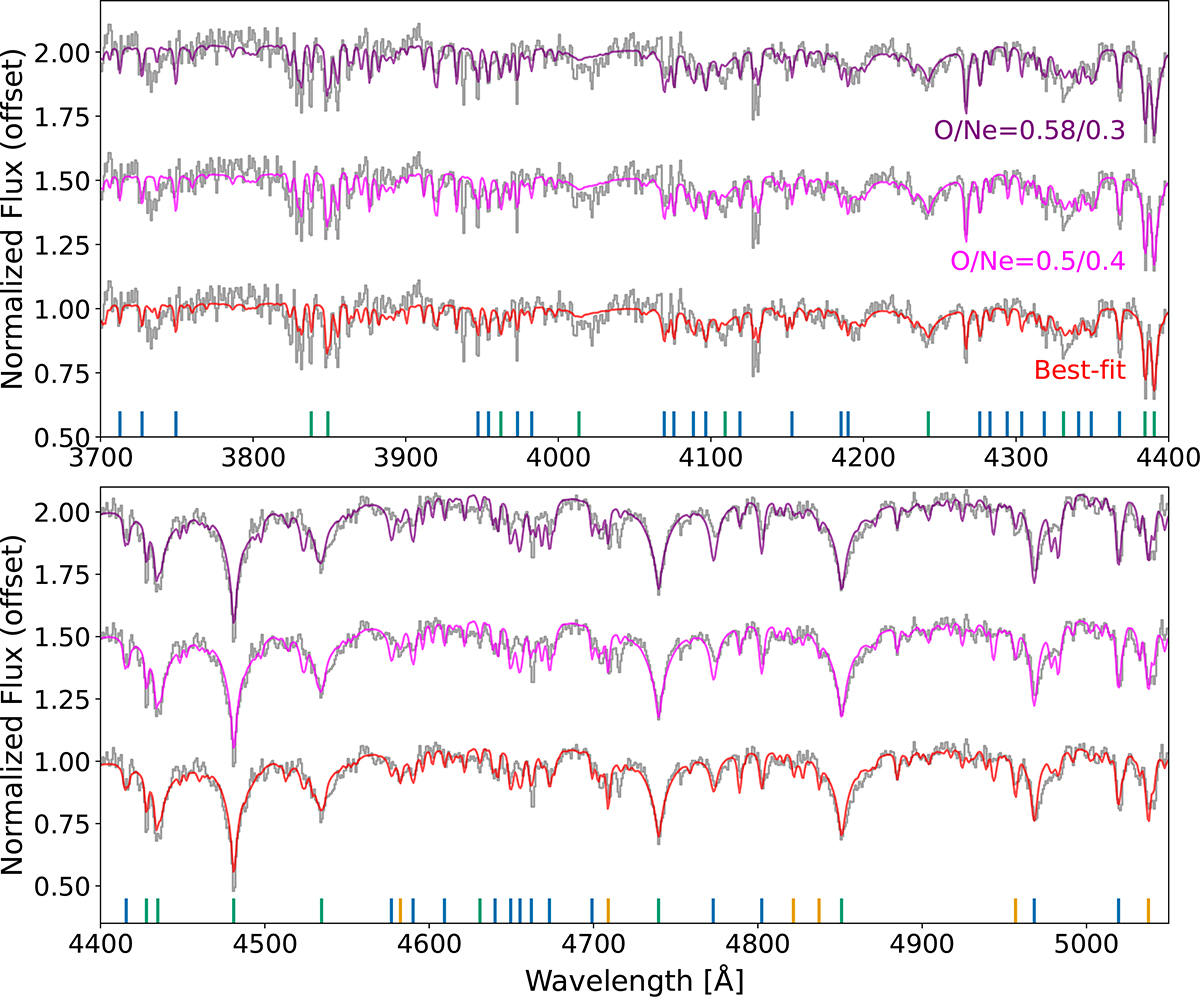
Fig. C.1.
Download original image
Comparison of three different models with different amounts of O/Ne. O/Ne ratios are given in terms of mass-fraction. The best-fit model has a nmass-fraction ratio of O/Ne of 0.28/0.67. The higher oxygen abundances lead to stronger oxygen lines such as the one at 4780 Å.
Current usage metrics show cumulative count of Article Views (full-text article views including HTML views, PDF and ePub downloads, according to the available data) and Abstracts Views on Vision4Press platform.
Data correspond to usage on the plateform after 2015. The current usage metrics is available 48-96 hours after online publication and is updated daily on week days.
Initial download of the metrics may take a while.