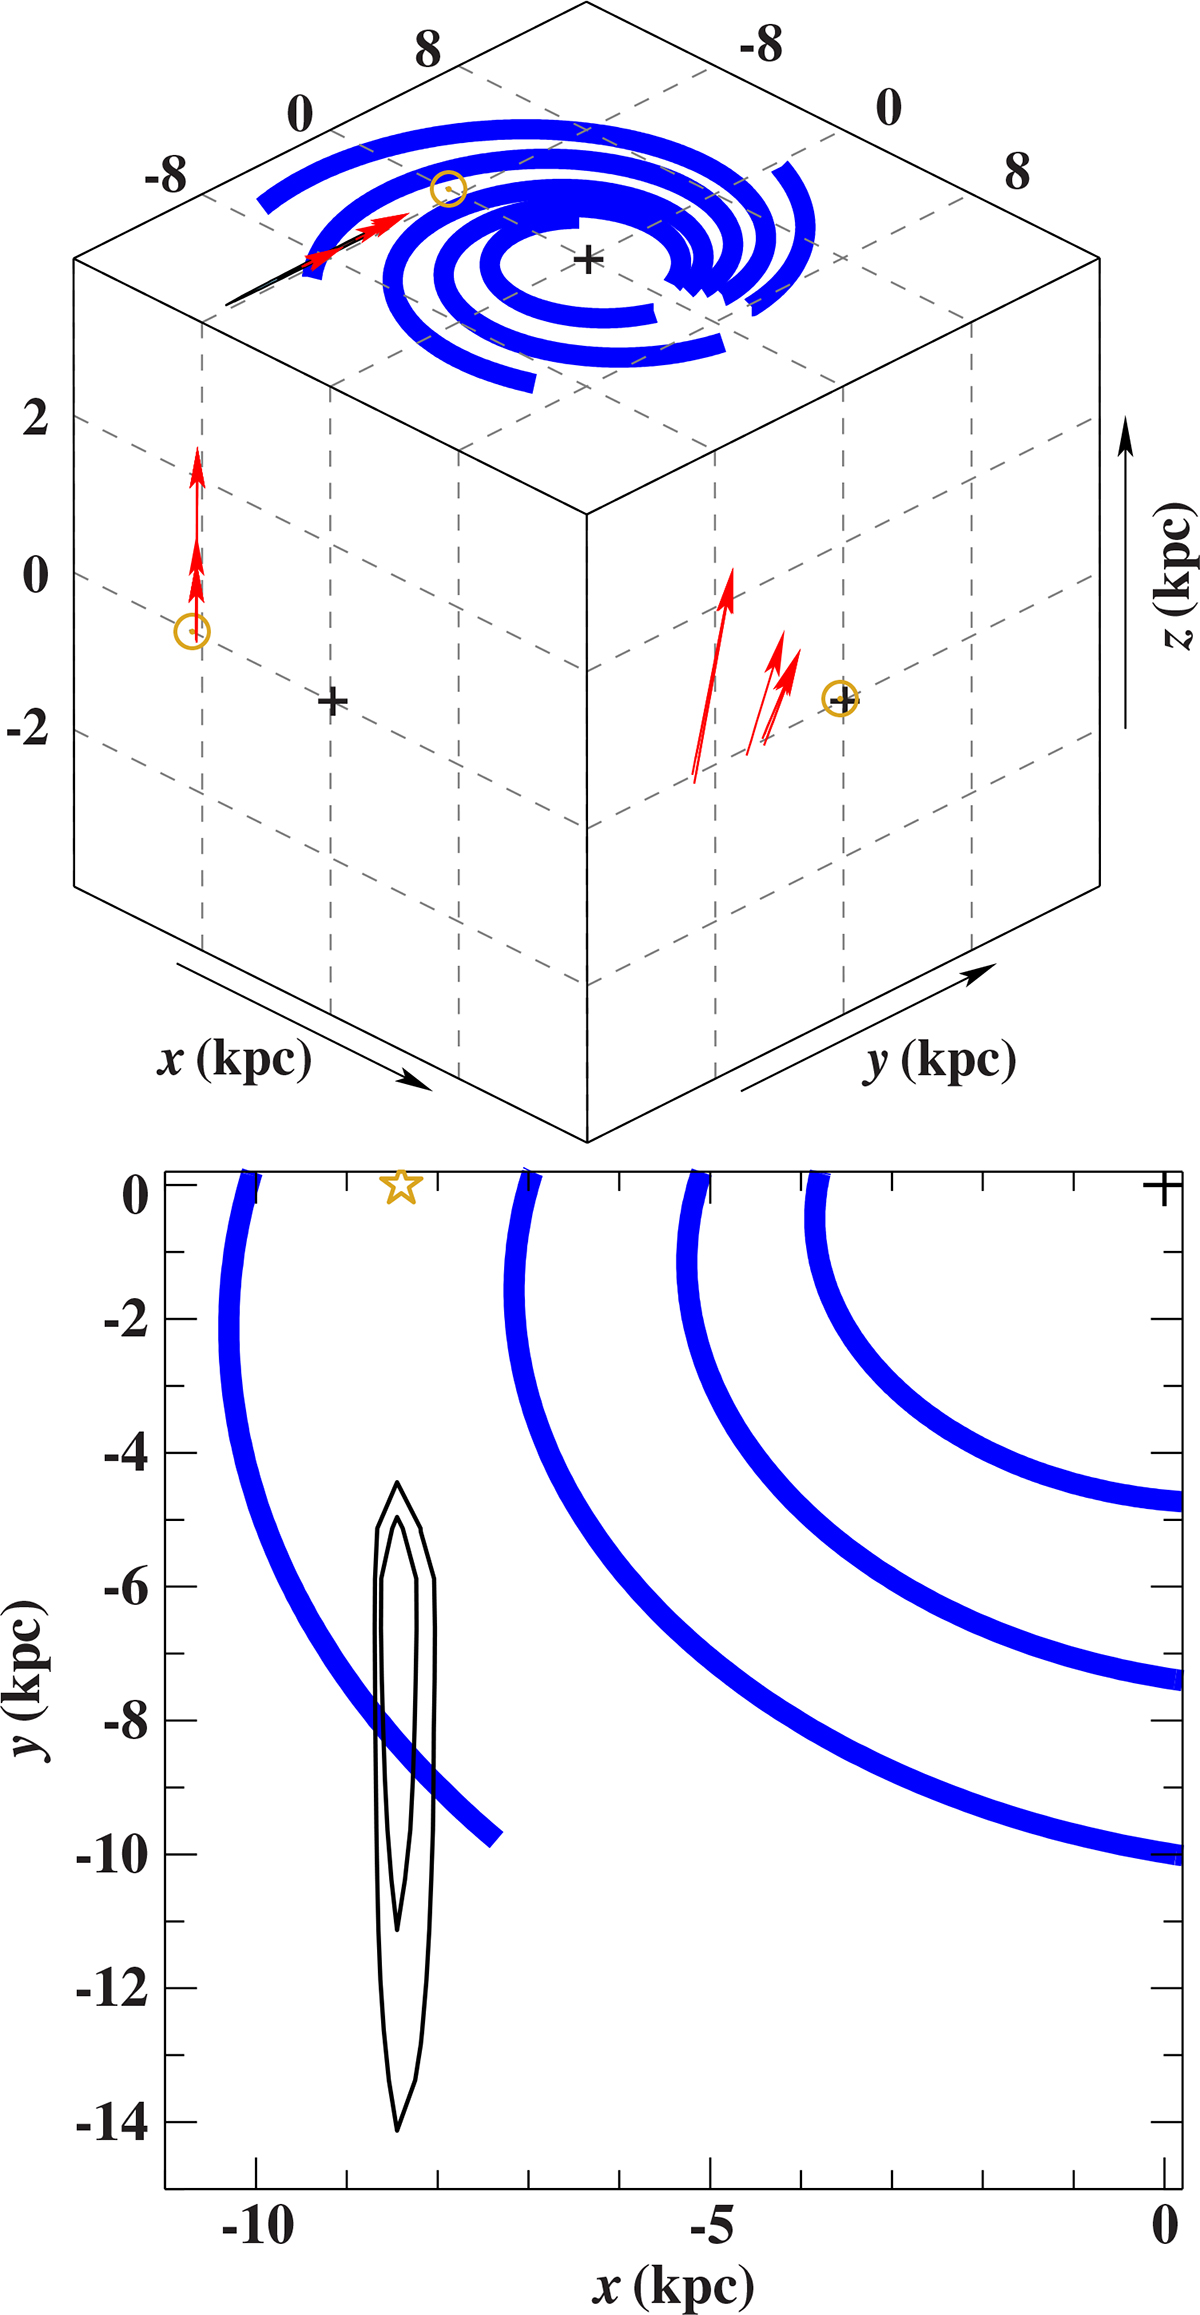
Fig. 6.
Download original image
Top panel: 3D kinematic trajectory of the star since disc ejection. Blue curves show representative spiral arms from Hou & Han (2014). The Sun is marked by the yellow circle and the Galactic centre by the black plus. Bottom panel: 2D plane-crossing contours marking regions where 68% and 95% of the trajectories intersected the Galactic plane when uncertainties were propagated.
Current usage metrics show cumulative count of Article Views (full-text article views including HTML views, PDF and ePub downloads, according to the available data) and Abstracts Views on Vision4Press platform.
Data correspond to usage on the plateform after 2015. The current usage metrics is available 48-96 hours after online publication and is updated daily on week days.
Initial download of the metrics may take a while.