Fig. 9.
Download original image
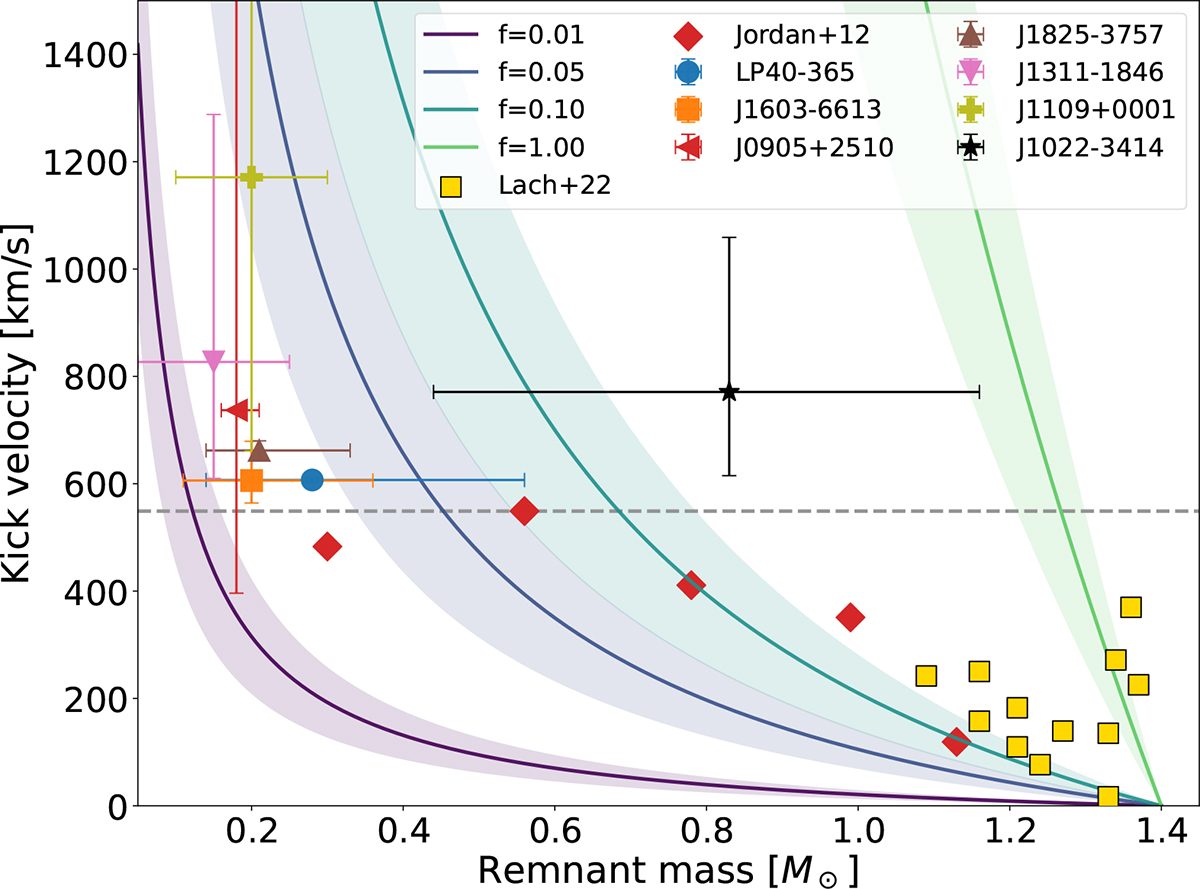
Ejection velocities of the observed LP 40−365 type stars as a function of their derived masses. Yellow squares and red diamonds are deflagration models from Lach et al. (2022) and Jordan et al. (2012), respectively. Curves show different kick velocities from ejecta derived using Eq. (1) for different asymmetry factors. The spread for each curve was computed using ejecta velocities between 3000 − 8000 km s−1. The dashed grey line shows the maximum velocity achieved by any model so far.
Current usage metrics show cumulative count of Article Views (full-text article views including HTML views, PDF and ePub downloads, according to the available data) and Abstracts Views on Vision4Press platform.
Data correspond to usage on the plateform after 2015. The current usage metrics is available 48-96 hours after online publication and is updated daily on week days.
Initial download of the metrics may take a while.