Fig. 1.
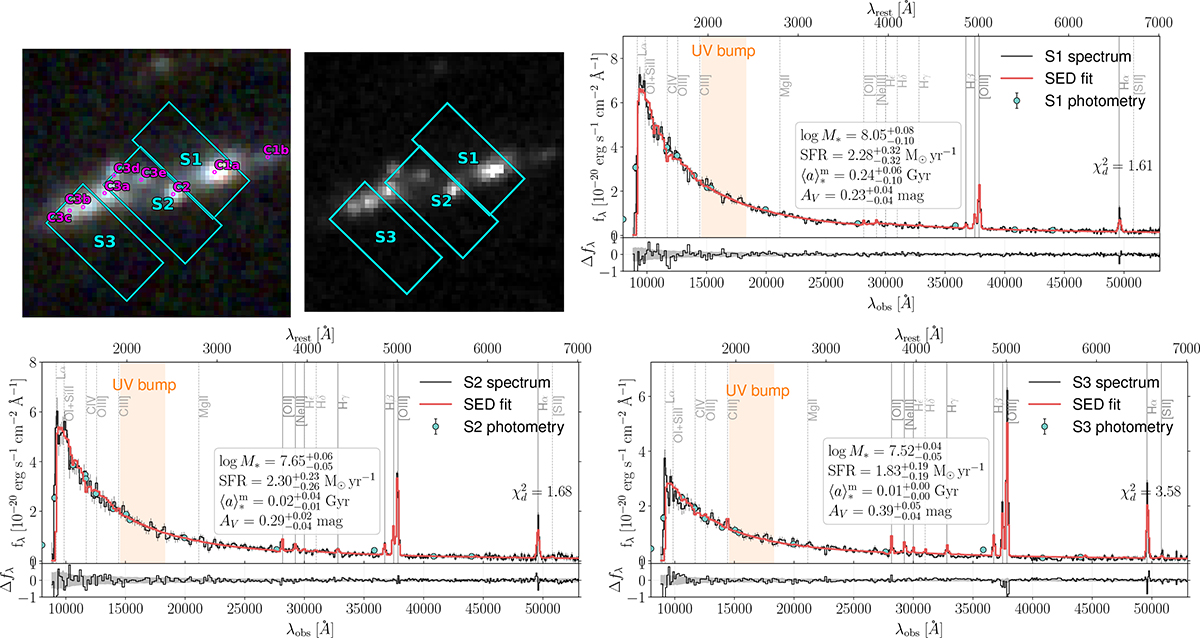
Download original image
NIRCam imaging, NIRSpec/PRISM spectroscopy, and the spectro-photometric fit for the bright LAE HCM 6A at z = 6.5676. Top left: Red-green-blue (RGB) composite image of the system constructed from JWST/NIRCam 20 mas imaging by assigning F200W to the red channel, F150W to the green channel, and F115W to the blue channel. Middle left: NIRCam F115W image of the system. The three adjacent NIRSpec slits (S1, S2, and S3) are overlaid on the RGB and F115W images targeting the three main clumps, C1–C3. Clumps C1 and C3 exhibit internal substructure and are composed of mini-clumps (C1a–C1b and C3a–C3e), ordered from brightest to faintest in the RGB image. Top-right and bottom panels: Slit-level photometry (teal circles), photometry-rescaled NIRSpec PRISM slit spectroscopy (black line), and the slit-level spectro-photometric fit using customized BAGPIPES (red line). Solid and dashed vertical lines indicate detected and undetected UV–optical emission lines, respectively. The vertical orange strip indicates the wavelength range of the UV bump absorption feature. The reduced chi-square, χν2, for each fit is shown in the top right. Insets: Basic galaxy properties derived from the SED fitting.
Current usage metrics show cumulative count of Article Views (full-text article views including HTML views, PDF and ePub downloads, according to the available data) and Abstracts Views on Vision4Press platform.
Data correspond to usage on the plateform after 2015. The current usage metrics is available 48-96 hours after online publication and is updated daily on week days.
Initial download of the metrics may take a while.