Fig. 4.
Download original image
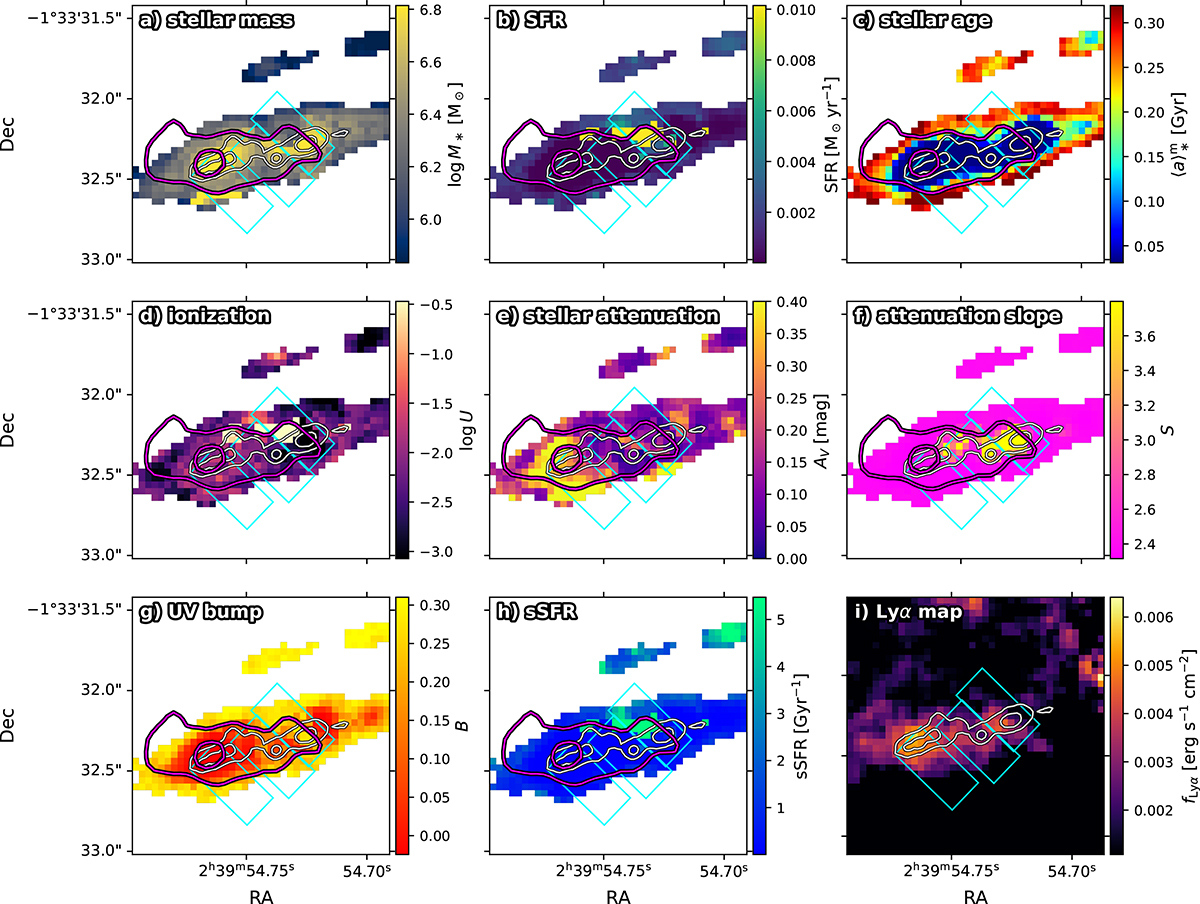
Pixel-level, spatially resolved physical properties of the target system: stellar mass (log M*; panel a), SFR (panel b), mass-weighted stellar age (![]() ; panel c), ionization parameter (log U; panel d), V-band attenuation (AV; panel e), slope (S; panel f) and UV bump (B; panel g) of the dust attenuation curve, sSFR (panel h), and Lyα flux (fLyα; panel i). The quantities log M*, SFR, and fLyα are corrected for lensing magnification. The three adjacent NIRSpec slits are overlaid as cyan rectangles. The NIRCam RGB map is shown as white contours at the 5σ and 10σ levels, while the Lyα emission is traced by magenta contours at 1−2σ.
; panel c), ionization parameter (log U; panel d), V-band attenuation (AV; panel e), slope (S; panel f) and UV bump (B; panel g) of the dust attenuation curve, sSFR (panel h), and Lyα flux (fLyα; panel i). The quantities log M*, SFR, and fLyα are corrected for lensing magnification. The three adjacent NIRSpec slits are overlaid as cyan rectangles. The NIRCam RGB map is shown as white contours at the 5σ and 10σ levels, while the Lyα emission is traced by magenta contours at 1−2σ.
Current usage metrics show cumulative count of Article Views (full-text article views including HTML views, PDF and ePub downloads, according to the available data) and Abstracts Views on Vision4Press platform.
Data correspond to usage on the plateform after 2015. The current usage metrics is available 48-96 hours after online publication and is updated daily on week days.
Initial download of the metrics may take a while.