Fig. 5.
Download original image
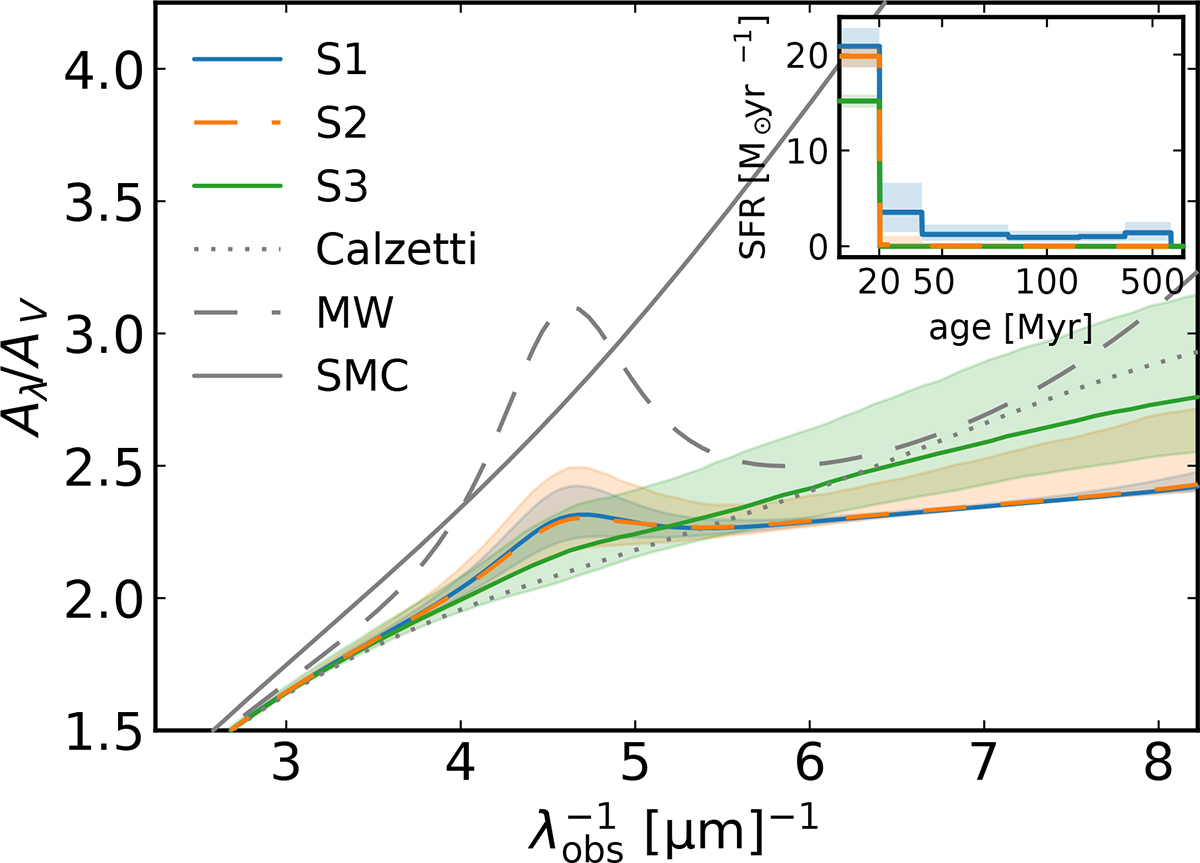
Dust attenuation curves of the three slit regions (S1–S3) at z = 6.5676 derived from the slit-level spectro-photometric fits. S1, S2, and S3 are shown as solid blue, dashed orange, and solid green lines, respectively. Standard Milky Way (MW), Calzetti, and Small Magellanic Cloud (SMC) attenuation curves are overplotted for comparison (dashed, dotted, and solid gray lines, respectively). Inset: Corresponding SFHs of the three slit regions.
Current usage metrics show cumulative count of Article Views (full-text article views including HTML views, PDF and ePub downloads, according to the available data) and Abstracts Views on Vision4Press platform.
Data correspond to usage on the plateform after 2015. The current usage metrics is available 48-96 hours after online publication and is updated daily on week days.
Initial download of the metrics may take a while.