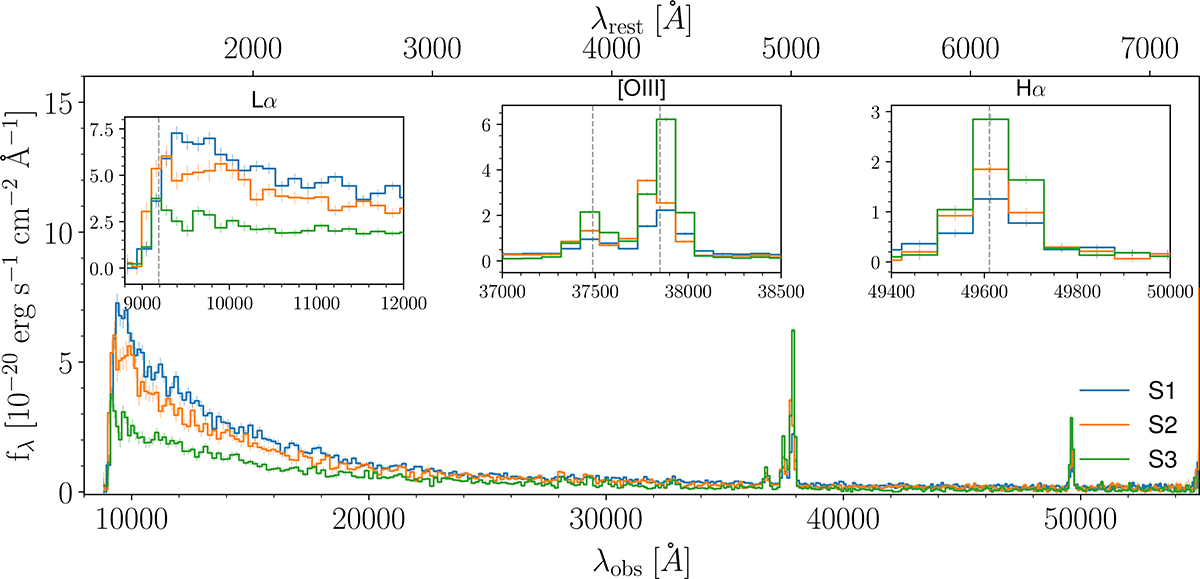
Fig. A.1.
Download original image
Photometry-rescaled NIRSpec PRISM slit spectra extracted from three adjacent slit regions (S1, S2, and S3; shown in blue, orange, and green, respectively). Main panel: Spectra as a function of observed wavelength, with the corresponding rest-frame wavelength shown on the upper axis. Insets: Zoomed-in views around the Lyα, [O III] doublet, and Hα emission-line regions (left, center, and right, respectively). Dashed vertical lines mark the expected wavelengths of the emission lines. Insets have the same spectral flux density (fλ) and observed wavelength (λobs) units as the main panel.
Current usage metrics show cumulative count of Article Views (full-text article views including HTML views, PDF and ePub downloads, according to the available data) and Abstracts Views on Vision4Press platform.
Data correspond to usage on the plateform after 2015. The current usage metrics is available 48-96 hours after online publication and is updated daily on week days.
Initial download of the metrics may take a while.