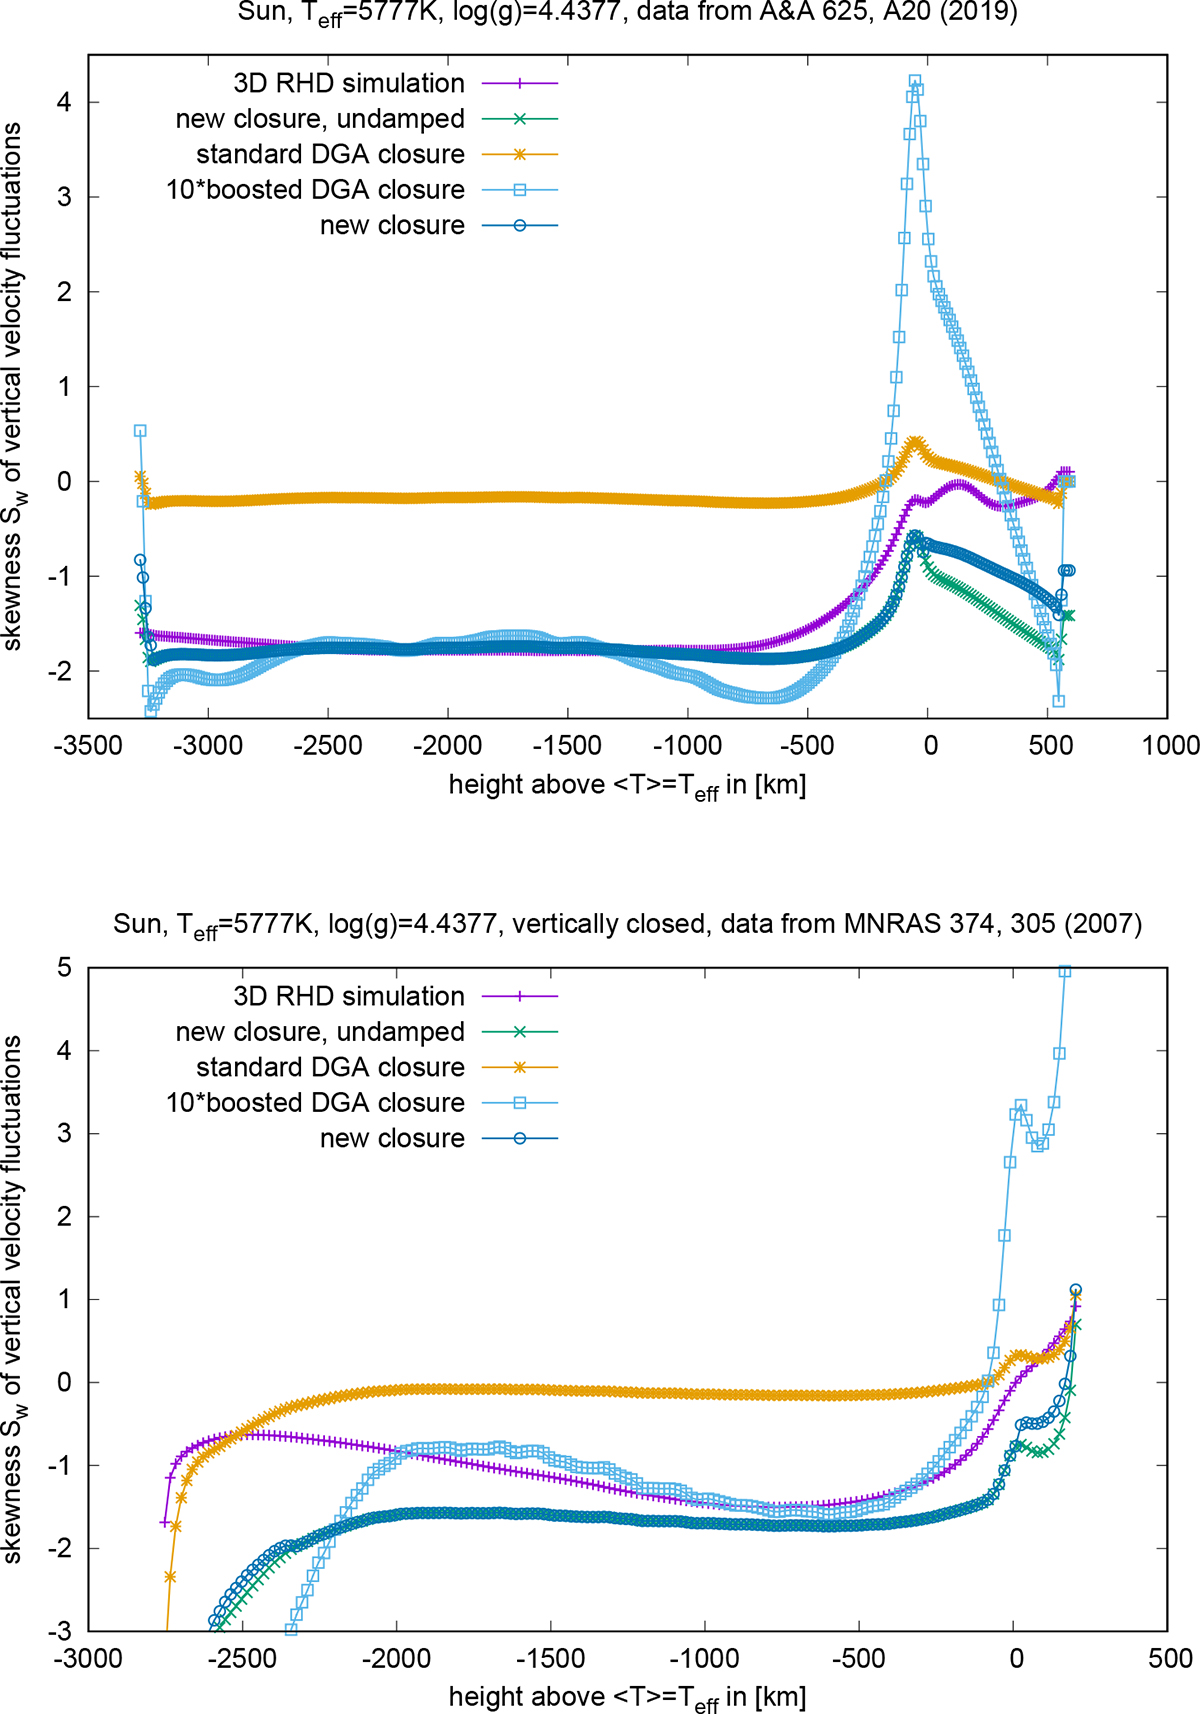
Fig. 1.
Download original image
Skewness of vertical velocity Sw in 3D RHD simulations of solar granulation. Top: Open vertical boundary conditions at top and bottom (using the code of Muthsam et al. 2010). Bottom: Closed vertical boundary conditions (using the code of Robinson et al. 2003). Data directly computed from the 3D RHD numerical simulations (purple line with crosses) are compared with the new TOM model and the DGA. For the new TOM model, the green line with x-shaped points shows the no damping case (c6 = 0). The full, new model (c6 = 0.1) is indicated by a dark blue line with circles. The light brown line with asterisks denotes the DGA (d3 = −0.1). The light blue line with squares shows the DGA with ten times larger turbulent diffusivity (d3 = −1).
Current usage metrics show cumulative count of Article Views (full-text article views including HTML views, PDF and ePub downloads, according to the available data) and Abstracts Views on Vision4Press platform.
Data correspond to usage on the plateform after 2015. The current usage metrics is available 48-96 hours after online publication and is updated daily on week days.
Initial download of the metrics may take a while.