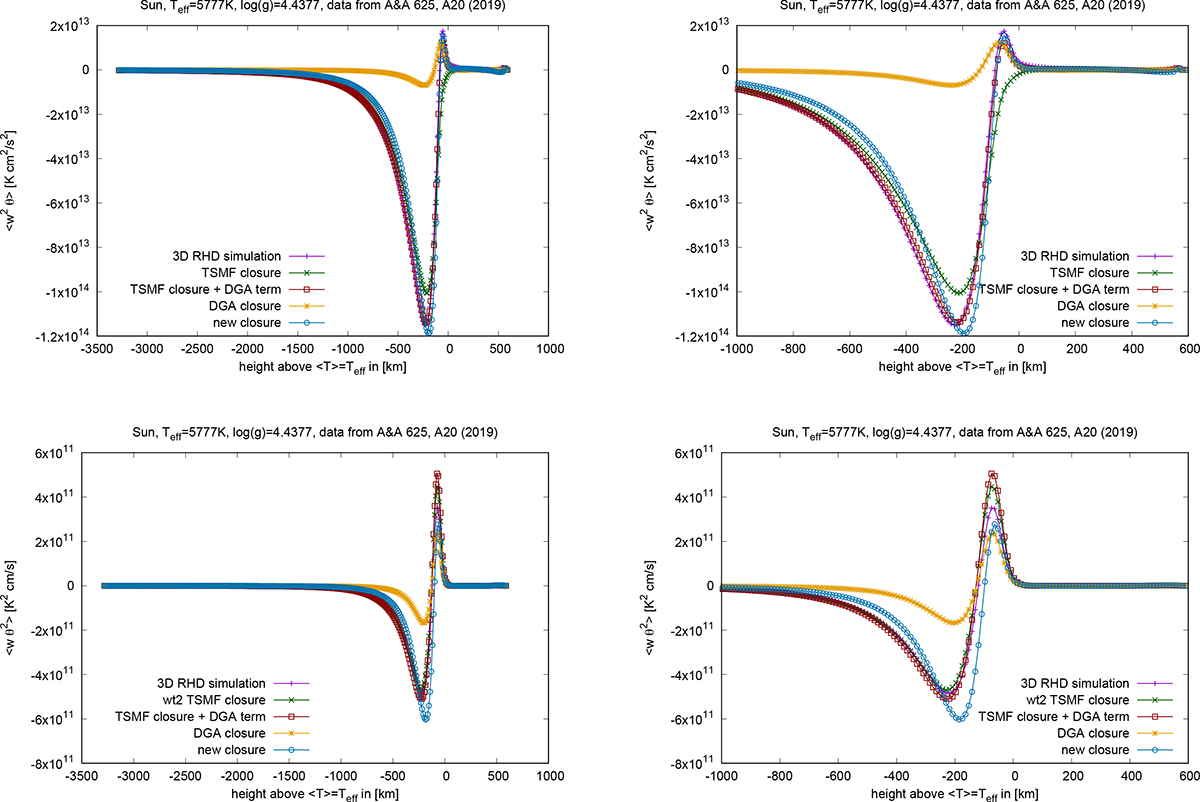
Fig. 3.
Download original image
Comparisons for the TOMs ![]() (top) and
(top) and ![]() (bottom). The simulation data and models are the same as those studied in Fig. 1 (top) and Fig. 2 (bottom) for Sw and
(bottom). The simulation data and models are the same as those studied in Fig. 1 (top) and Fig. 2 (bottom) for Sw and ![]() , respectively: each panel displays results for the solar surface 3D RHD simulation with open vertical boundary conditions. The full vertical range is displayed in the left column of panels. The right column of panels zooms into the upper 40% of the simulation domain. The same colour coding was used as for Fig. 1. In addition, the results obtained for the TSMF closure with DGA (dark red line with asterisks) and without (dark green line with crosses) are shown. For both variants of the TSMF model, the quantity Sw was computed directly from 3D RHD data, as explained in the main text.
, respectively: each panel displays results for the solar surface 3D RHD simulation with open vertical boundary conditions. The full vertical range is displayed in the left column of panels. The right column of panels zooms into the upper 40% of the simulation domain. The same colour coding was used as for Fig. 1. In addition, the results obtained for the TSMF closure with DGA (dark red line with asterisks) and without (dark green line with crosses) are shown. For both variants of the TSMF model, the quantity Sw was computed directly from 3D RHD data, as explained in the main text.
Current usage metrics show cumulative count of Article Views (full-text article views including HTML views, PDF and ePub downloads, according to the available data) and Abstracts Views on Vision4Press platform.
Data correspond to usage on the plateform after 2015. The current usage metrics is available 48-96 hours after online publication and is updated daily on week days.
Initial download of the metrics may take a while.