Fig. 5.
Download original image
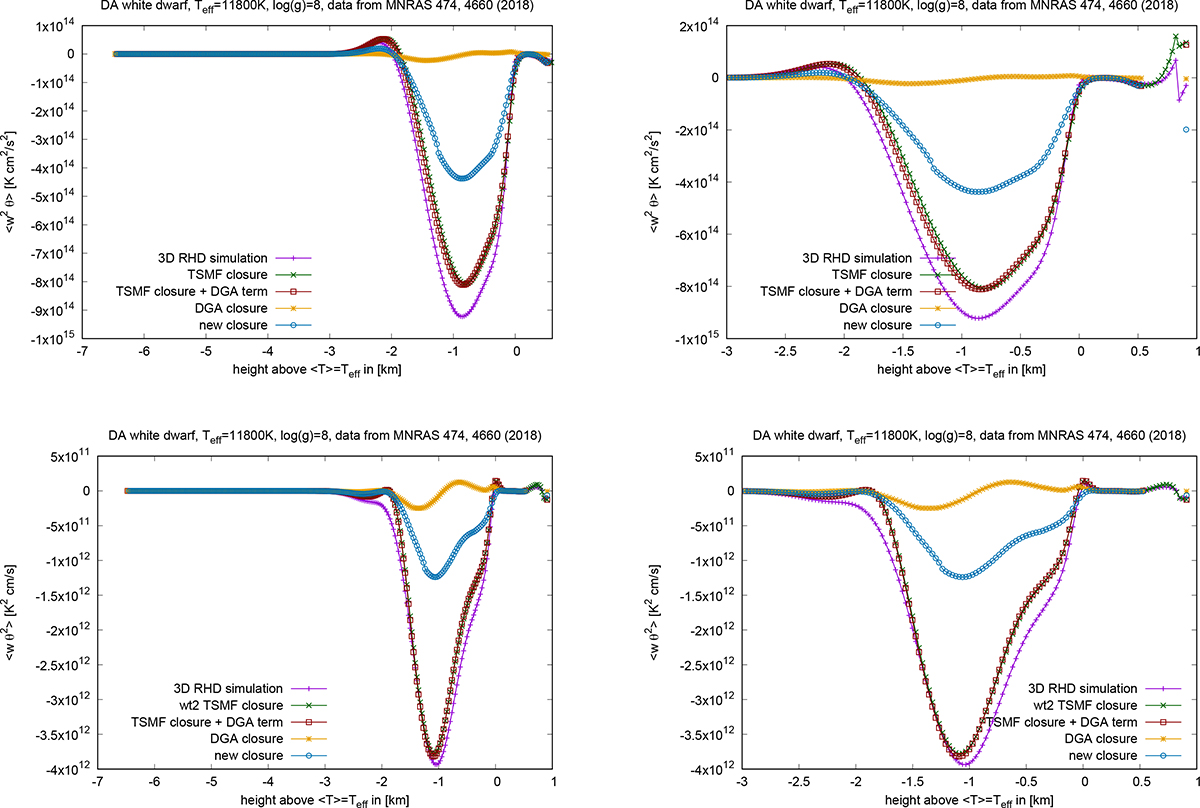
Testing closure models for the TOMs ![]() and
and ![]() with data of a 3D RHD simulation of envelope convection in a DA white dwarf. The same models as those given in Figs. 1 and 3 are used here. The case of the TOM
with data of a 3D RHD simulation of envelope convection in a DA white dwarf. The same models as those given in Figs. 1 and 3 are used here. The case of the TOM ![]() is shown in the top row for the full vertical range (left) and for the upper half of the domain (right). For the line style and colour coding, see Fig. 3. The bottom row repeats this comparison for
is shown in the top row for the full vertical range (left) and for the upper half of the domain (right). For the line style and colour coding, see Fig. 3. The bottom row repeats this comparison for ![]() . A discussion of the results is given in the main text.
. A discussion of the results is given in the main text.
Current usage metrics show cumulative count of Article Views (full-text article views including HTML views, PDF and ePub downloads, according to the available data) and Abstracts Views on Vision4Press platform.
Data correspond to usage on the plateform after 2015. The current usage metrics is available 48-96 hours after online publication and is updated daily on week days.
Initial download of the metrics may take a while.