Fig. B.1.
Download original image
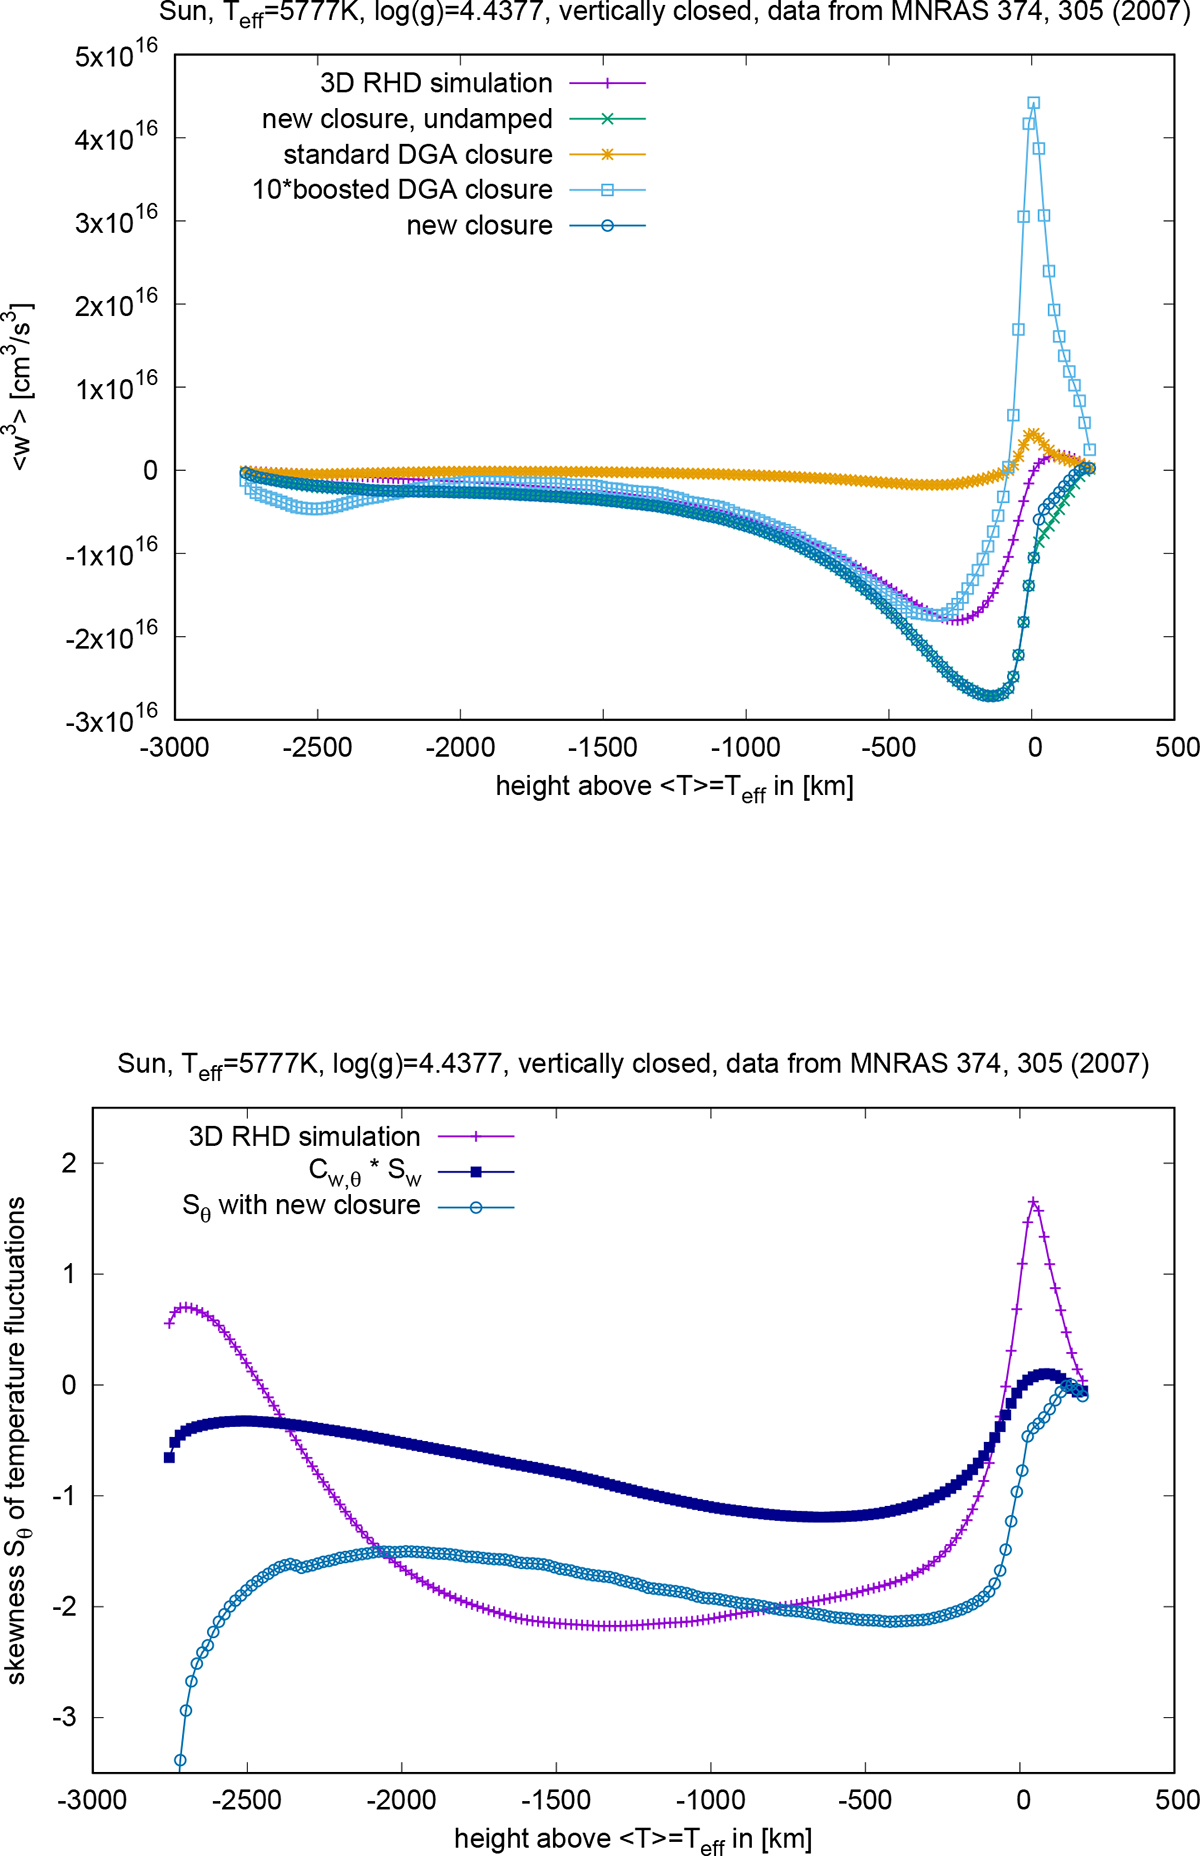
Further investigation of the models for the TOM ![]() and the skewness of temperature Sθ. The top panel shows
and the skewness of temperature Sθ. The top panel shows ![]() and the bottom one shows Sθ. The closure models as well as colour and line style coding are the same as in Fig. 2, but for the case of the 3D RHD simulation of solar surface convection with closed vertical boundary conditions.
and the bottom one shows Sθ. The closure models as well as colour and line style coding are the same as in Fig. 2, but for the case of the 3D RHD simulation of solar surface convection with closed vertical boundary conditions.
Current usage metrics show cumulative count of Article Views (full-text article views including HTML views, PDF and ePub downloads, according to the available data) and Abstracts Views on Vision4Press platform.
Data correspond to usage on the plateform after 2015. The current usage metrics is available 48-96 hours after online publication and is updated daily on week days.
Initial download of the metrics may take a while.