Open Access
Fig. B.2.
Download original image
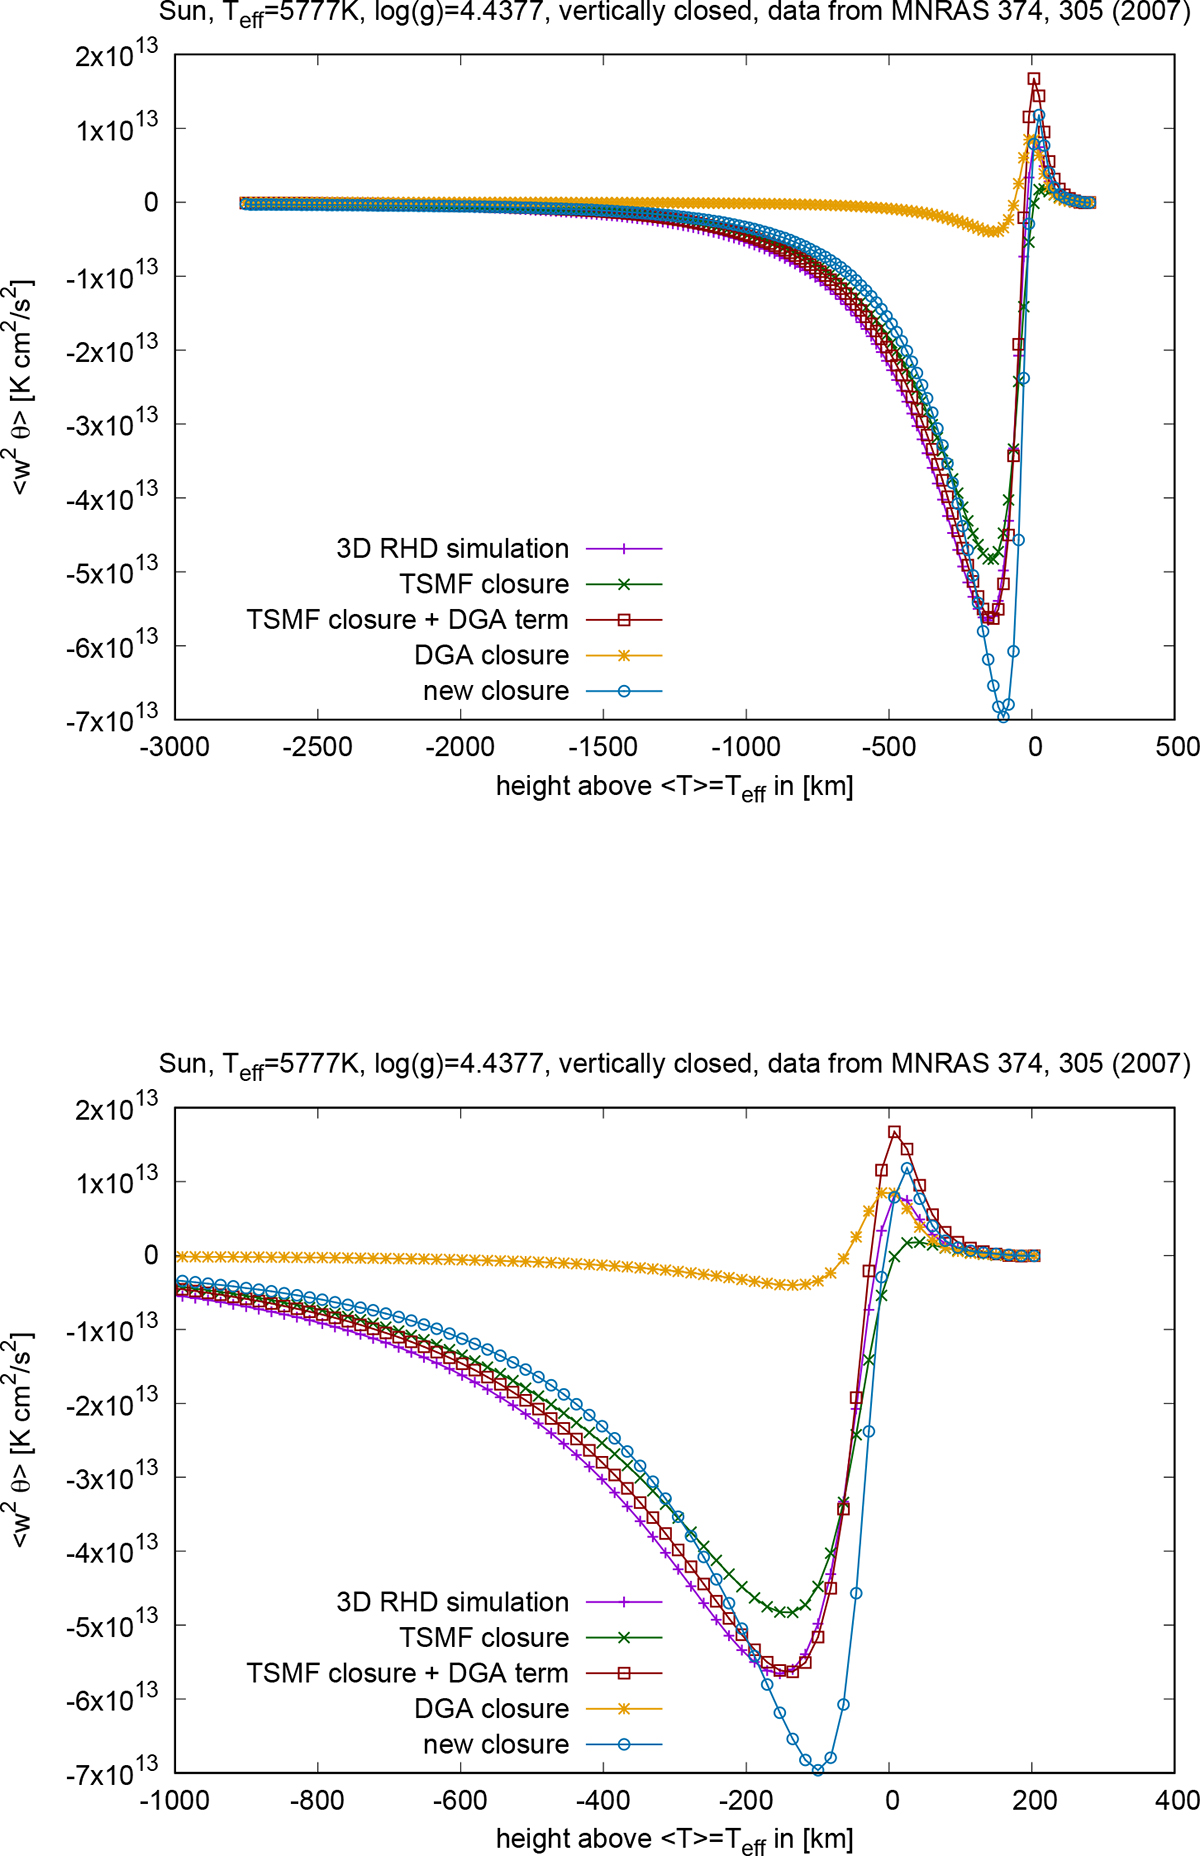
Probing the TOM ![]() with 3D RHD solar simulation data for closed vertical boundary conditions. Details on the line style and colour coding are explained in the captions to Figs. 2 and 3. The top panel shows the full vertical depth range and the bottom panel shows a zoom into the upper 40% of that range.
with 3D RHD solar simulation data for closed vertical boundary conditions. Details on the line style and colour coding are explained in the captions to Figs. 2 and 3. The top panel shows the full vertical depth range and the bottom panel shows a zoom into the upper 40% of that range.
Current usage metrics show cumulative count of Article Views (full-text article views including HTML views, PDF and ePub downloads, according to the available data) and Abstracts Views on Vision4Press platform.
Data correspond to usage on the plateform after 2015. The current usage metrics is available 48-96 hours after online publication and is updated daily on week days.
Initial download of the metrics may take a while.