Fig. 10
Download original image
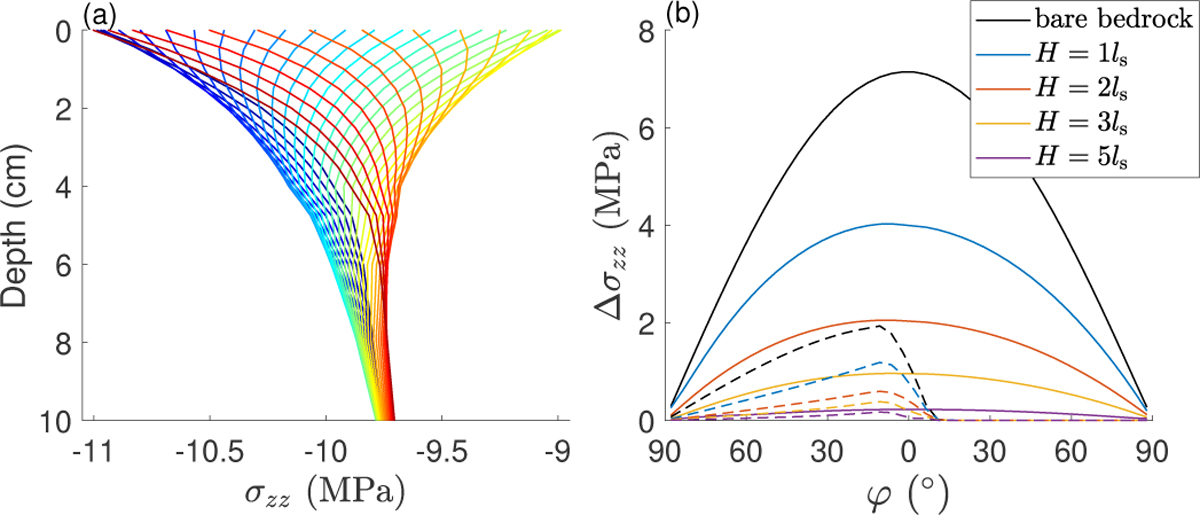
Diurnal stress field for Model 1. (a) Diurnal thermal stress profiles at φ = 0. The colors of the lines represent different times through one rotation period. (b) Diurnal thermal stress excursions with different thicknesses of the regolith layer. Solid lines show the cases when θ = 270◦, and dashed lines show the cases when θ = 0.
Current usage metrics show cumulative count of Article Views (full-text article views including HTML views, PDF and ePub downloads, according to the available data) and Abstracts Views on Vision4Press platform.
Data correspond to usage on the plateform after 2015. The current usage metrics is available 48-96 hours after online publication and is updated daily on week days.
Initial download of the metrics may take a while.