Fig. 11
Download original image
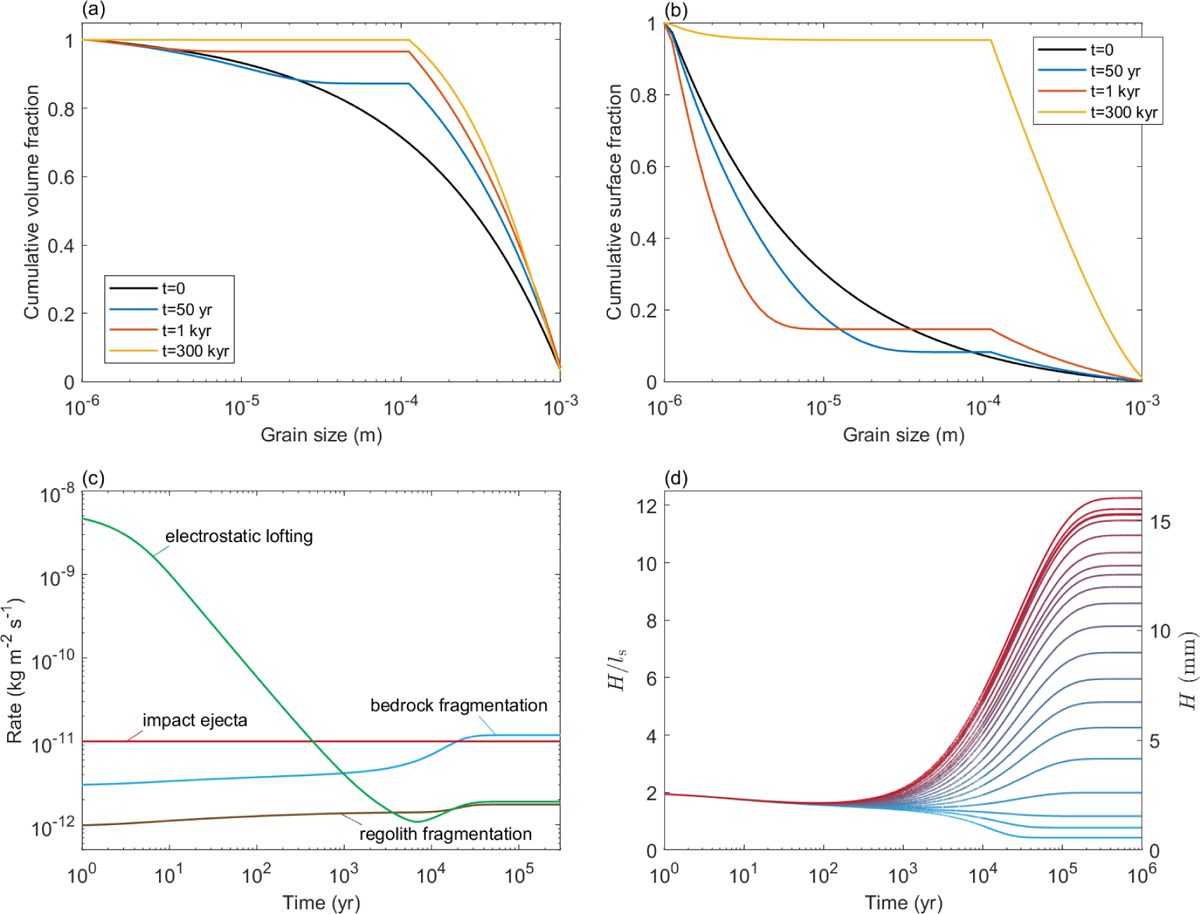
Regolith grain size and thickness evolution for Model 1. (a) Cumulative volume fraction at the equator. (b) Cumulative surface fraction at the equator. (c) Evolution of mass changing rates at the equator. We show the transient processes of bedrock thermal fragmentation (blue line), micro-impacts ejecta (red line), electrostatic dust lofting (green line), and regolith thermal fragmentation (brown line). (d) Thickness evolution at different latitudes. The colors for latitudes change from blue at the equator to red at the pole. The left and right ordinates show dimensionless and dimensional thicknesses of the regolith layer, respectively.
Current usage metrics show cumulative count of Article Views (full-text article views including HTML views, PDF and ePub downloads, according to the available data) and Abstracts Views on Vision4Press platform.
Data correspond to usage on the plateform after 2015. The current usage metrics is available 48-96 hours after online publication and is updated daily on week days.
Initial download of the metrics may take a while.