Fig. 12
Download original image
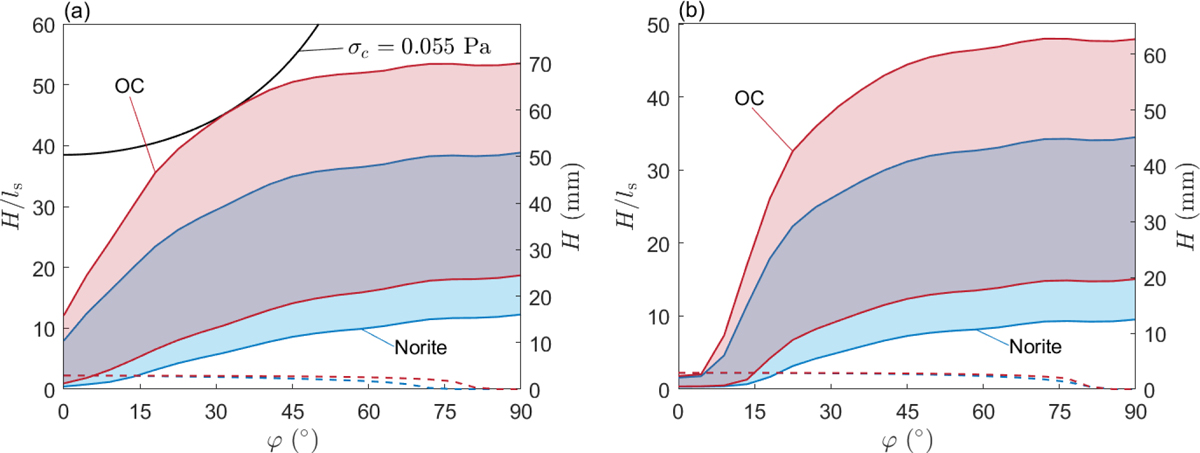
Equilibrium regolith thicknesses at different latitudes. Panels a and b show the results for models with γ = 99.3◦ and γ = 45◦, respectively. The equilibrium thickness ranges for ordinary chondrite material are shown by the shaded red areas, and the ones for norite material by the blue. The dashed lines represent scenarios with only diurnal thermal fragmentation, with the same choice of colors for the different materials. The left and right ordinates show dimensionless and dimensional thicknesses of the regolith layer, respectively. In panel a, the black line indicates that the highest H (φ) is allowed by a cohesive strength of 0.055 Pa.
Current usage metrics show cumulative count of Article Views (full-text article views including HTML views, PDF and ePub downloads, according to the available data) and Abstracts Views on Vision4Press platform.
Data correspond to usage on the plateform after 2015. The current usage metrics is available 48-96 hours after online publication and is updated daily on week days.
Initial download of the metrics may take a while.