Open Access
Fig. 5
Download original image
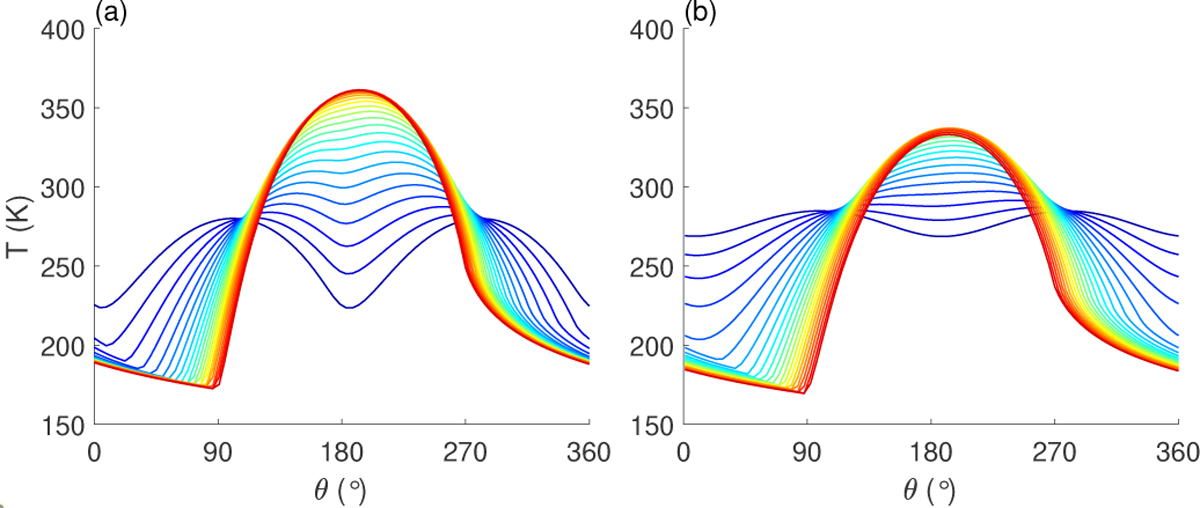
Seasonal temperature cycles for the top of the bedrock for H = 2ls. Latitudes from the equator to the north pole are represented by lines with colors from blue to red (θ is the orbital phase). Panels a and b show the cases for Model 1 and Model 2, respectively.
Current usage metrics show cumulative count of Article Views (full-text article views including HTML views, PDF and ePub downloads, according to the available data) and Abstracts Views on Vision4Press platform.
Data correspond to usage on the plateform after 2015. The current usage metrics is available 48-96 hours after online publication and is updated daily on week days.
Initial download of the metrics may take a while.