Fig. 7
Download original image
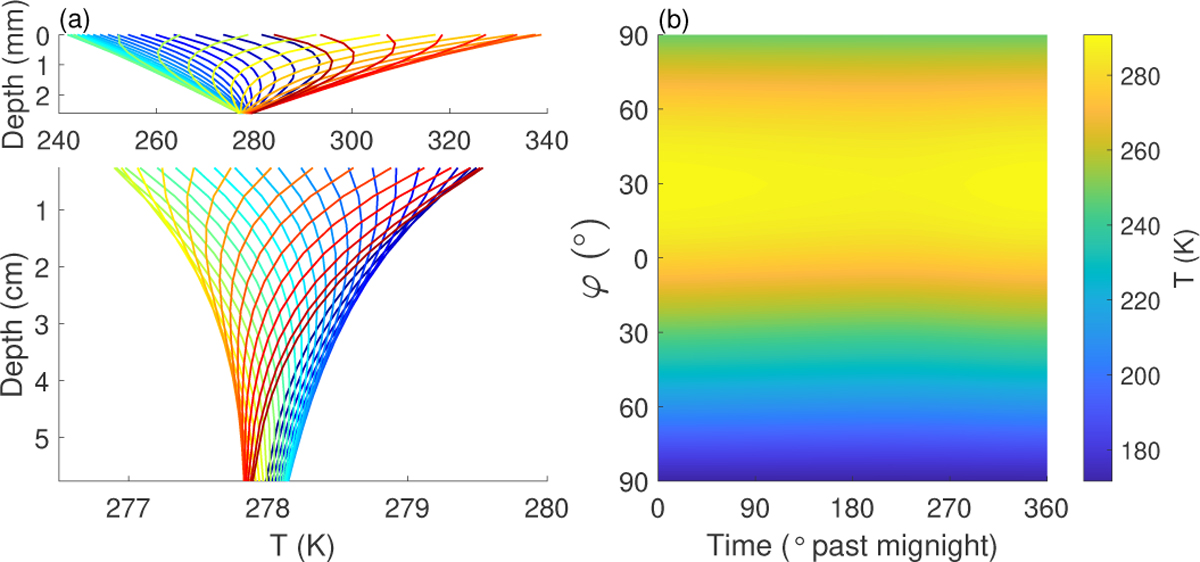
Diurnal temperature field example at γ = 99.3◦, θ = 270◦, and H/ls = 2. (a) Temperature at depth at φ = 0 for regolith (upper) and near-surface bedrock (bottom). Lines with different colors represent different times, beginning with dark blue at midnight. (b) Temperature contour in the space of latitude and time within one rotation period.
Current usage metrics show cumulative count of Article Views (full-text article views including HTML views, PDF and ePub downloads, according to the available data) and Abstracts Views on Vision4Press platform.
Data correspond to usage on the plateform after 2015. The current usage metrics is available 48-96 hours after online publication and is updated daily on week days.
Initial download of the metrics may take a while.