Fig. 8
Download original image
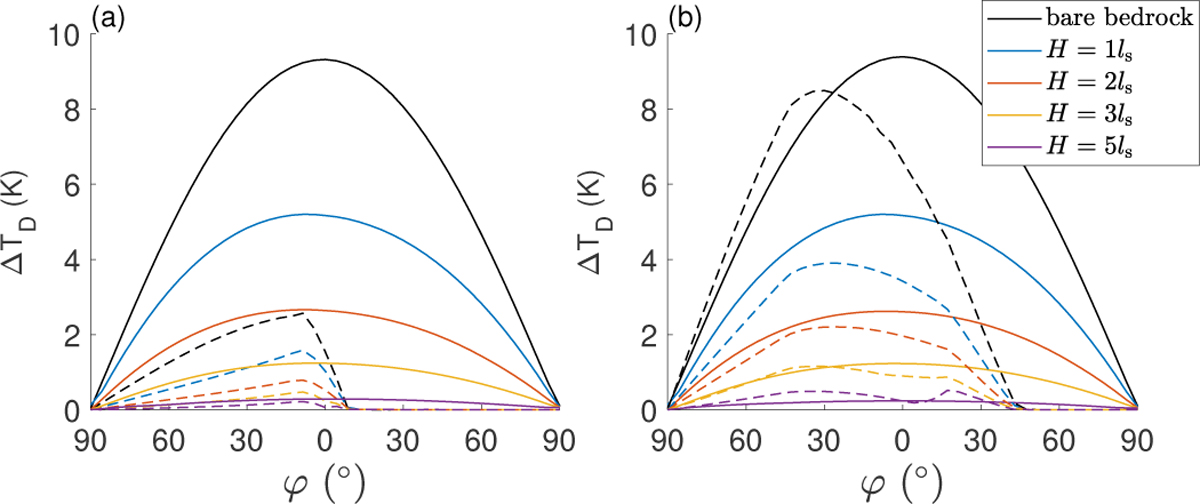
Diurnal temperature excursions. The left half of the abscissas is for the southern hemisphere and the right half for the northern. The solid lines represent cases at equinox (θ = 270◦), and the dashed lines represent cases when θ = 0. Cases with different H are plotted from 0 to 5ls with different colors. Panels a and b show the cases for Model 1 and Model 2, respectively.
Current usage metrics show cumulative count of Article Views (full-text article views including HTML views, PDF and ePub downloads, according to the available data) and Abstracts Views on Vision4Press platform.
Data correspond to usage on the plateform after 2015. The current usage metrics is available 48-96 hours after online publication and is updated daily on week days.
Initial download of the metrics may take a while.