Fig. 1
Download original image
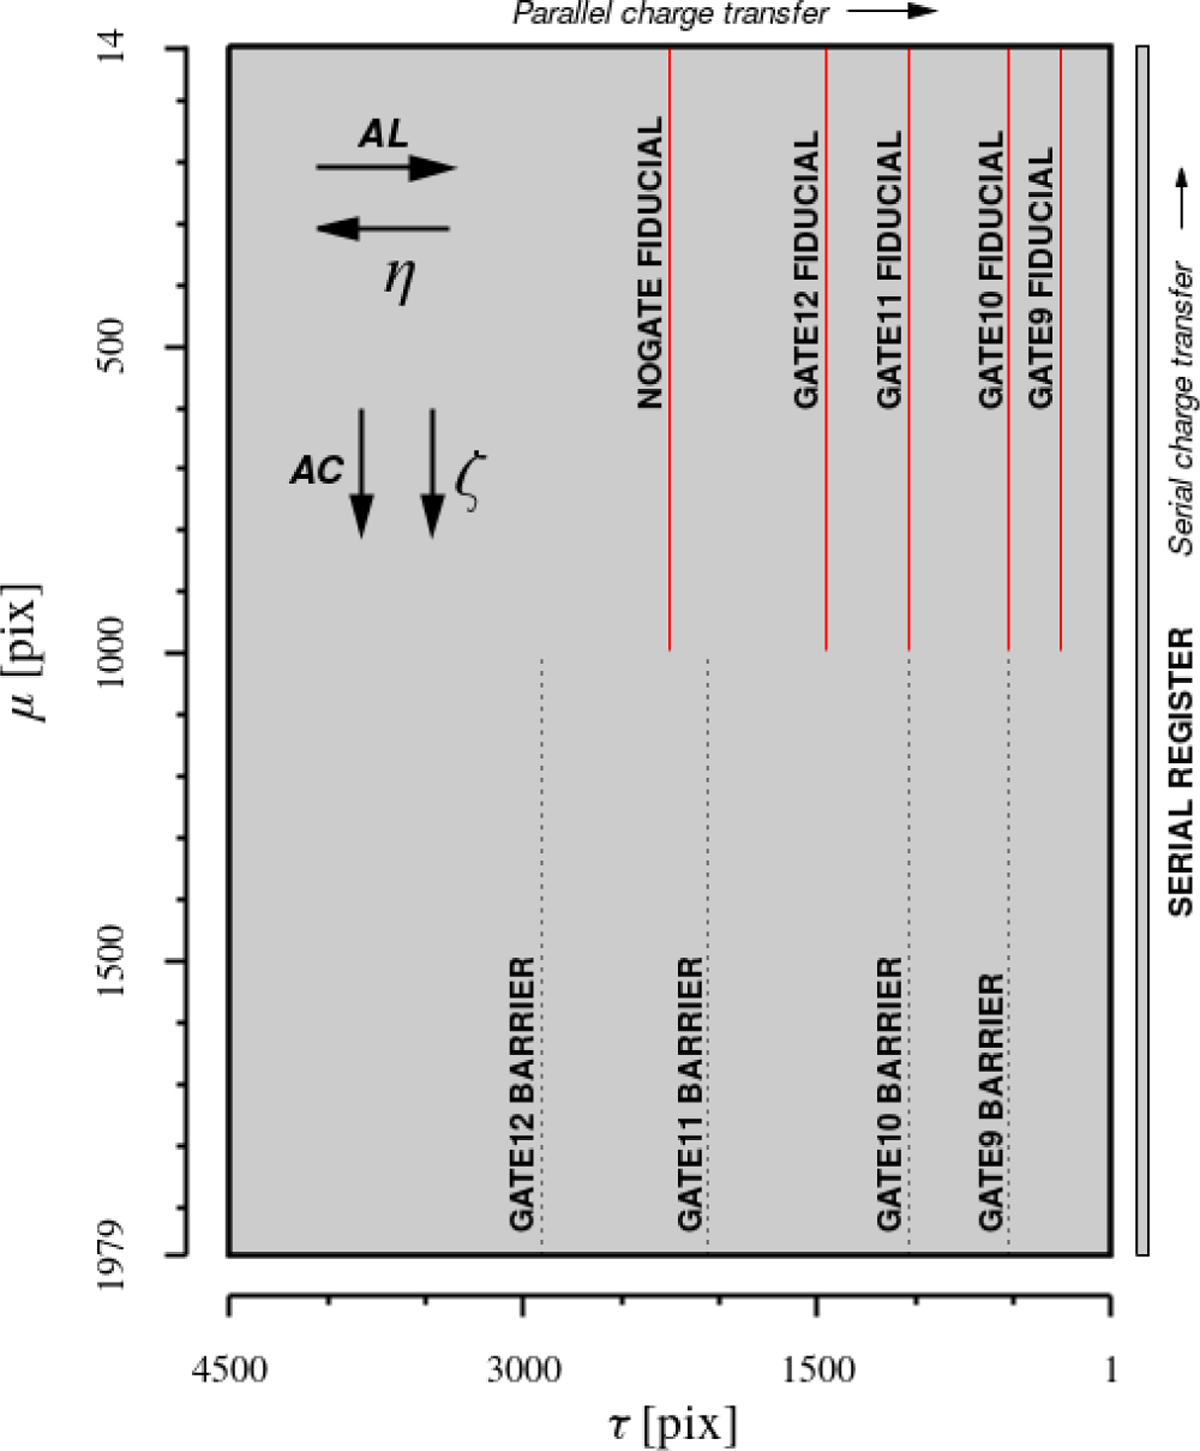
Schematic diagram of one of Gaia’s CCDs, as seen from the illuminated side and showing various features relevant to the PSF modelling. The (τ,μ) coordinates represent positions within the pixel grid. The images of stars move from left to right during integration, with the serial register lying on the right. The main AL and AC directions and their relation to the field angles η and ζ are indicated at the top left. Fiducial lines and barriers for the five longest gates are indicated; NOGATE has no corresponding barrier and uses the entire AL range.
Current usage metrics show cumulative count of Article Views (full-text article views including HTML views, PDF and ePub downloads, according to the available data) and Abstracts Views on Vision4Press platform.
Data correspond to usage on the plateform after 2015. The current usage metrics is available 48-96 hours after online publication and is updated daily on week days.
Initial download of the metrics may take a while.