Fig. 13
Download original image
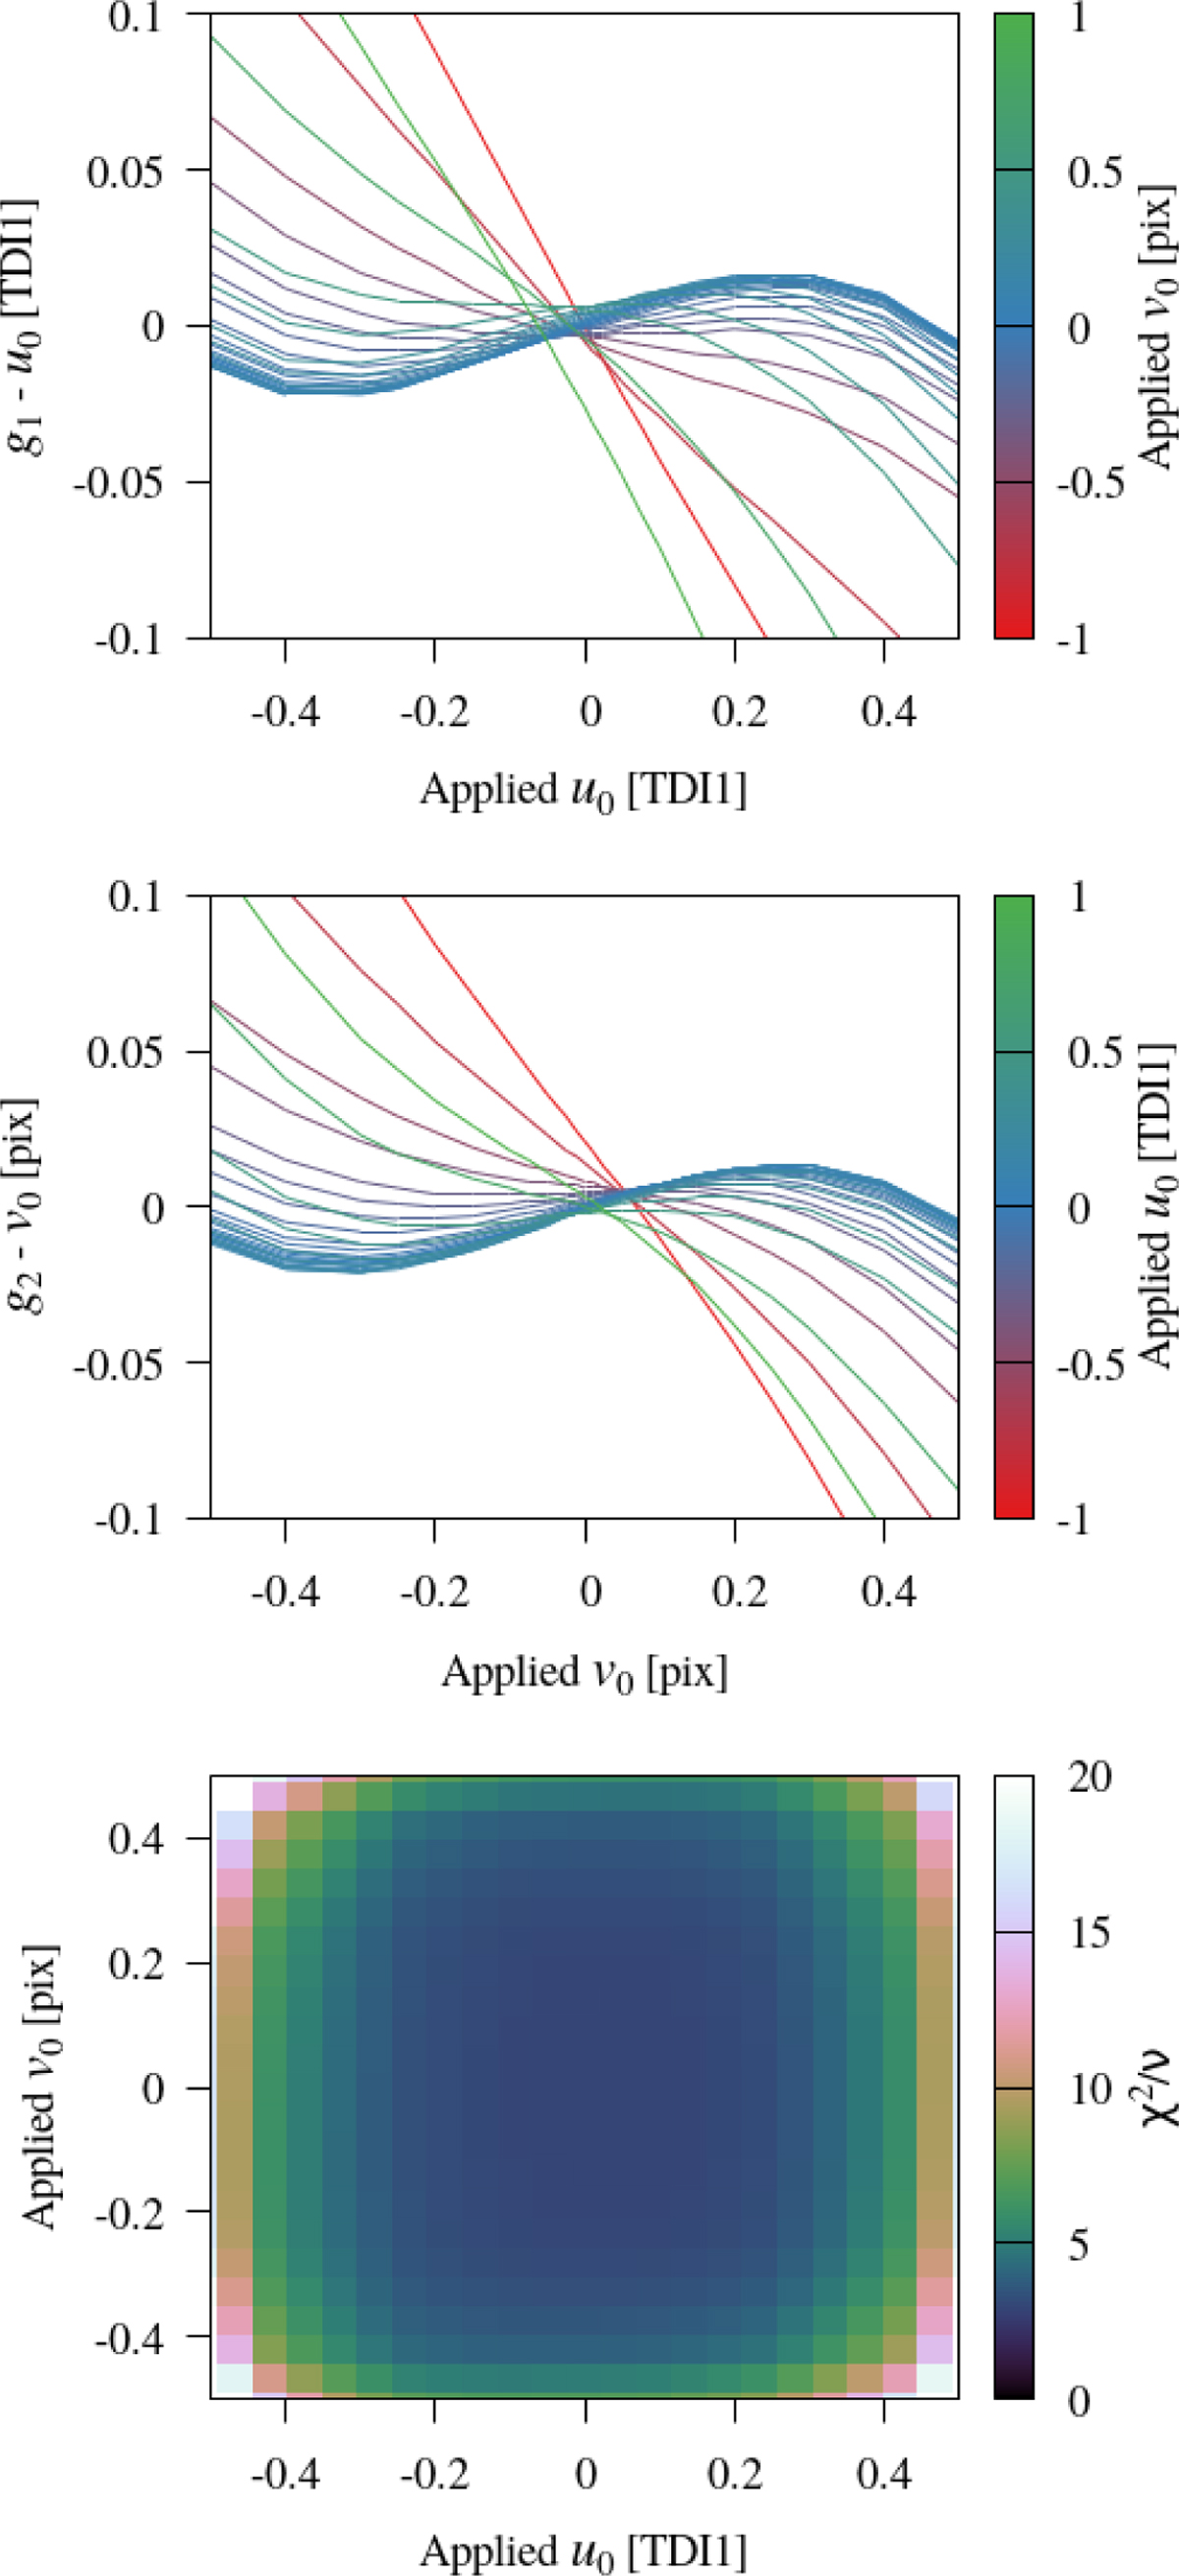
Tests of the calibration of the AL and AC shifts using the linearised PSF model. The upper two panels depict the differences between the estimated AL (g1) and AC (g2) shifts and the applied values (u0 and v0) as a function of u0 and v0 . The lower panel depicts the goodness-of-fit of the solution as a function of u0 and v0, in terms of the χ2 per degree of freedom.
Current usage metrics show cumulative count of Article Views (full-text article views including HTML views, PDF and ePub downloads, according to the available data) and Abstracts Views on Vision4Press platform.
Data correspond to usage on the plateform after 2015. The current usage metrics is available 48-96 hours after online publication and is updated daily on week days.
Initial download of the metrics may take a while.