Fig. 17
Download original image
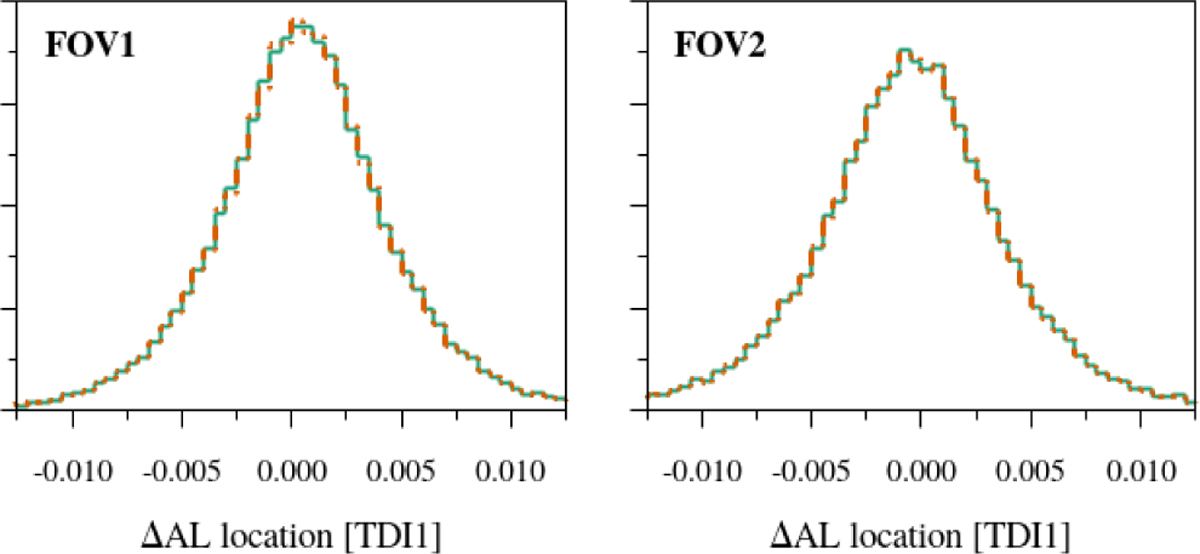
Distribution of the estimated AL source locations relative to their ground truth values, obtained from selected 1D window class 1 observations in the CCD in row 5 AF5 and corresponding to FOV1 (left) and FOV2 (right). The dot-dashed orange line corresponds to the recalibrated DR3 LSF model and the green line corresponds to the DR4 LSF model. The plots are normalised to unit area, so the vertical scale is arbitrary and omitted for clarity.
Current usage metrics show cumulative count of Article Views (full-text article views including HTML views, PDF and ePub downloads, according to the available data) and Abstracts Views on Vision4Press platform.
Data correspond to usage on the plateform after 2015. The current usage metrics is available 48-96 hours after online publication and is updated daily on week days.
Initial download of the metrics may take a while.