Fig. 18
Download original image
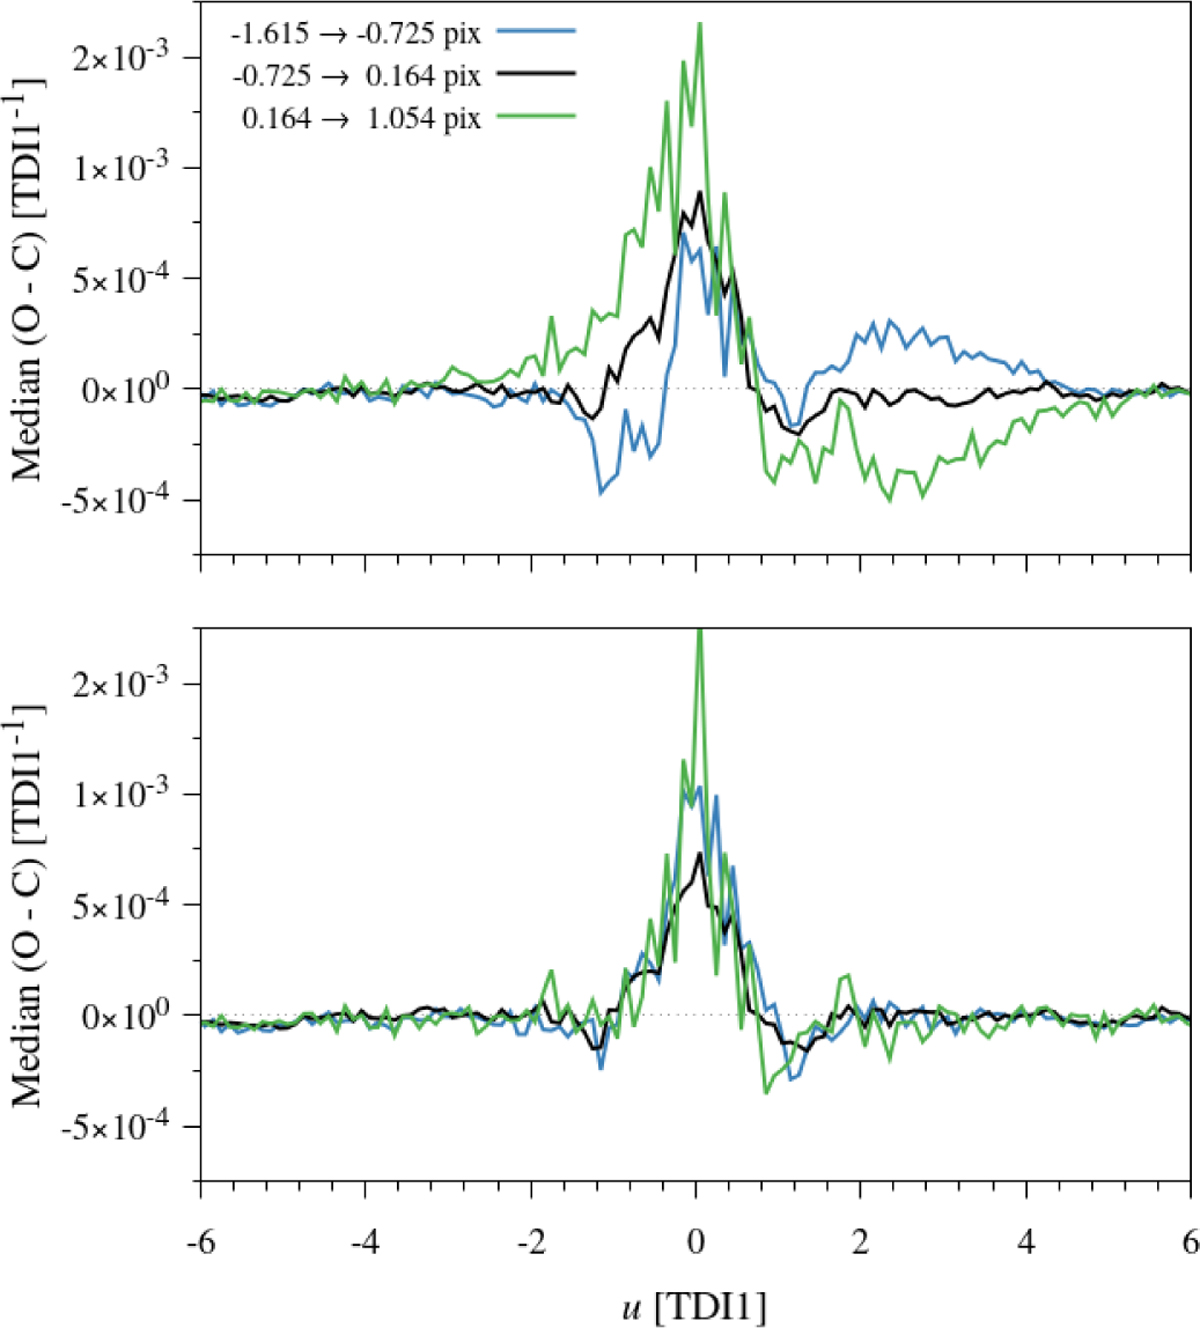
Median residuals between the LSF model and selected 1D observations split into three equal percentiles of source AC location relative to the window centre as indicated in the key, in units of pixels. The solid black line depicts the central third (33-66%), with the lower and upper thirds depicted by the blue and green lines, respectively. In the upper panel, the LSF model has no dependence on the source AC location, whereas in the lower panel this is modelled using a second order spline with no knots (i.e. a simple linear dependence on source AC location; see footnote 16).
Current usage metrics show cumulative count of Article Views (full-text article views including HTML views, PDF and ePub downloads, according to the available data) and Abstracts Views on Vision4Press platform.
Data correspond to usage on the plateform after 2015. The current usage metrics is available 48-96 hours after online publication and is updated daily on week days.
Initial download of the metrics may take a while.