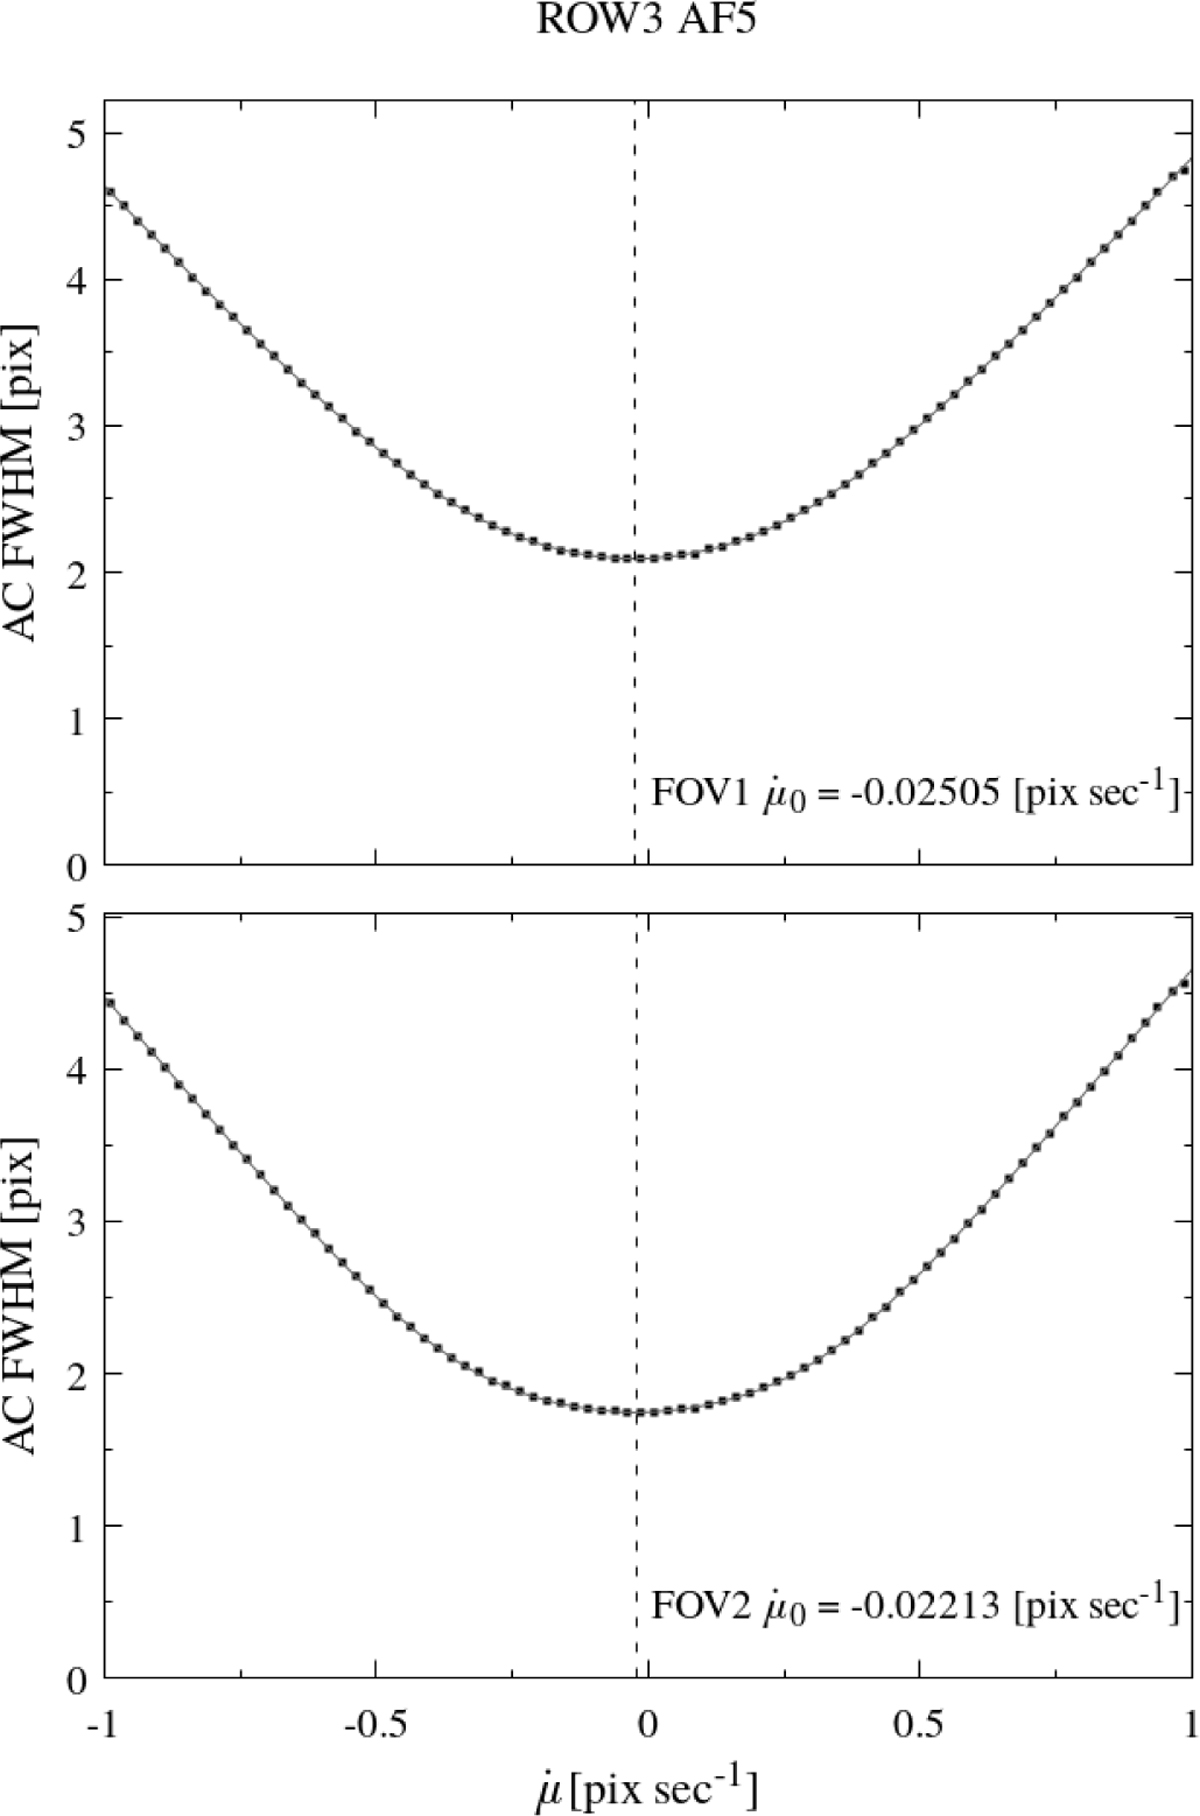
Fig. B.2
Download original image
Example estimation of the native AC rate μ̇0 for FOV1 (upper panel) and FOV2 (lower) in the same device (ROW3 AF5). The value of μ̇0 coincides with the AC rate for which the AC FWHM is minimised, as determined by fitting an appropriate pseudo-hyperbolic function (grey line) through the data (black dots). The vertical dashed lines indicate the minimum of the interpolating function, which provides the estimate of μ̇0.
Current usage metrics show cumulative count of Article Views (full-text article views including HTML views, PDF and ePub downloads, according to the available data) and Abstracts Views on Vision4Press platform.
Data correspond to usage on the plateform after 2015. The current usage metrics is available 48-96 hours after online publication and is updated daily on week days.
Initial download of the metrics may take a while.