Fig. 4
Download original image
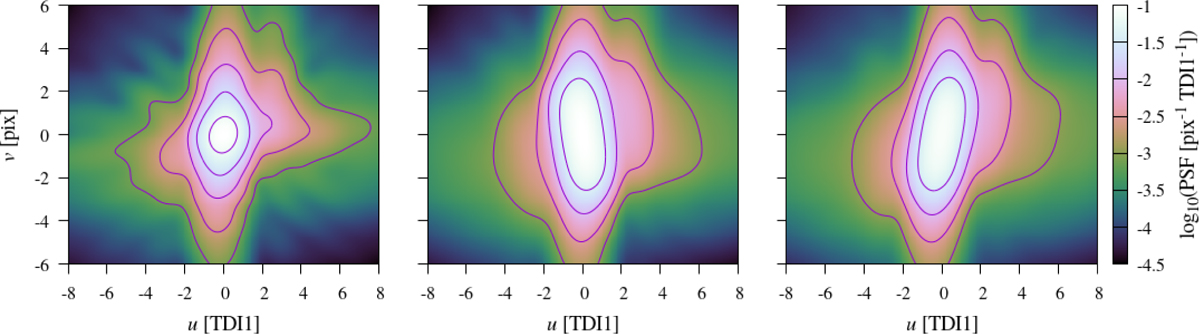
Effects of AL and AC source motion on the PSF. These plots depict the integrated effective PSF for three different regimes of τ̇ and μ̇. The u and v coordinates are relative to the PSF origin, as explained at the start of Sect. 4.1. These plots have been generated using the calibrated PSF model presented later in this paper, and correspond to the FOV1 PSF for NOGATE observations in the ROW2 AF4 device. In the left panel τ̇ = τ̇0 and μ̇ = μ̇0 such that the stellar image motion is perfectly matched to the charge transfer and no smearing occurs in either dimension. In both the centre and right panels τ̇ - τ̇0 = 0.226 pix s−1, such that the stellar image lags one pixel behind the charge in the AL direction during the 4.42 second exposure. In the centre and right panels μ̇ - μ̇0 = 0.974 and −0.974 pix s−1 respectively, such that the stellar image moves ±4.3 pixels in the AC direction, orthogonally to the charge transfer. Note that the τ̇ value is about 20 times larger than what is routinely observed in the real data, in order to make the impact on the PSF more obvious for the plots. Throughout this paper we make use of the cubehelix colour scheme introduced in Green (2011).
Current usage metrics show cumulative count of Article Views (full-text article views including HTML views, PDF and ePub downloads, according to the available data) and Abstracts Views on Vision4Press platform.
Data correspond to usage on the plateform after 2015. The current usage metrics is available 48-96 hours after online publication and is updated daily on week days.
Initial download of the metrics may take a while.