Fig. 8
Download original image
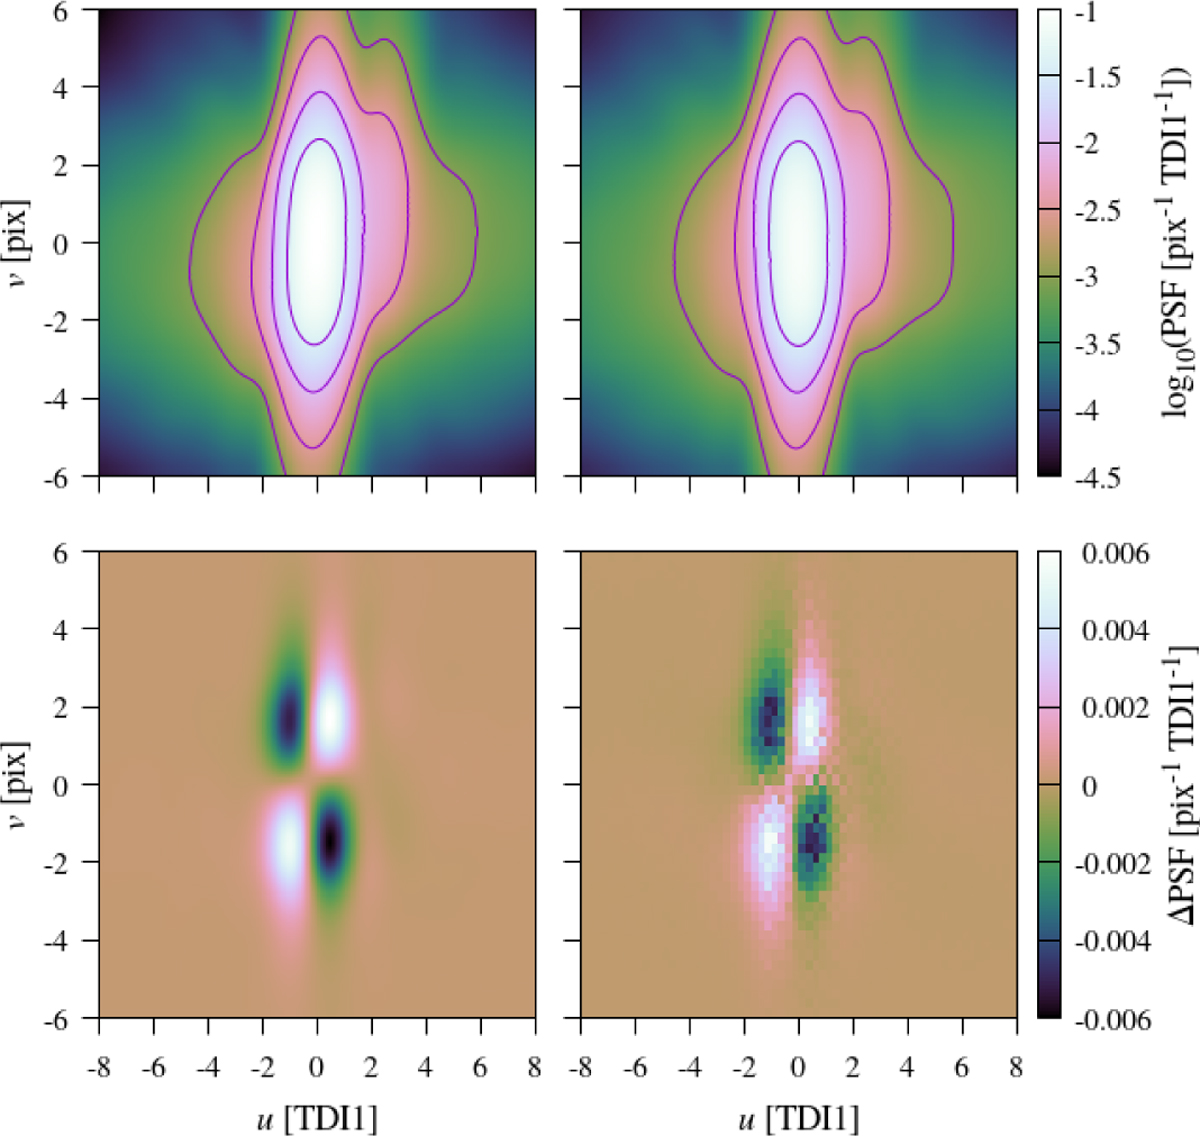
Reproduction of the effects of AL and AC source motion in the PSF model. The upper two panels show two model PSFs that are identical apart from the configured AL and AC source motion: in both cases τ̇ - τ̇0 = −0.045 pix s−1 while μ̇ - μ̇0 = −0.975 (left) and 0.975 (right) pix s−1. The lower left panel shows the difference between the two, which is dominated by the reversed sign of the shearing effect due to the change in sign of the AC rate. The lower right panel depicts the equivalent effect seen directly in the data, and is produced by stacking many observations at μ̇ − μ̇0 > 0.975 and μ̇ - μ̇0 < -0.975 pix s−1 and plotting the difference.
Current usage metrics show cumulative count of Article Views (full-text article views including HTML views, PDF and ePub downloads, according to the available data) and Abstracts Views on Vision4Press platform.
Data correspond to usage on the plateform after 2015. The current usage metrics is available 48-96 hours after online publication and is updated daily on week days.
Initial download of the metrics may take a while.