Open Access
Fig. 3.
Download original image
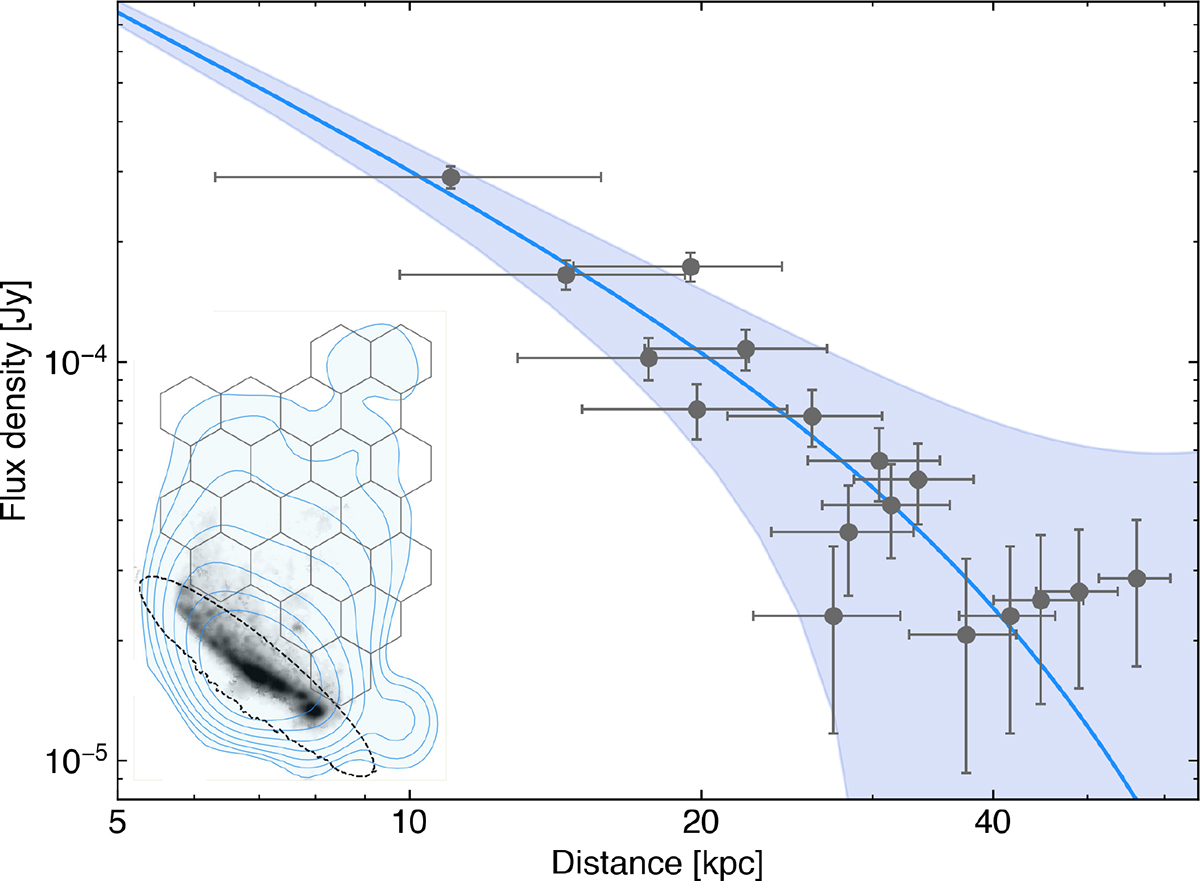
Radio flux density vs. distance from the stellar disk edge. In the left corner, we show the sampling grid overlayed on the radio continuum emission shown in Fig. 1. The best-fitting profile is shown by the blue line. The blue-shaded region indicates the 1σ uncertainties on the fit.
Current usage metrics show cumulative count of Article Views (full-text article views including HTML views, PDF and ePub downloads, according to the available data) and Abstracts Views on Vision4Press platform.
Data correspond to usage on the plateform after 2015. The current usage metrics is available 48-96 hours after online publication and is updated daily on week days.
Initial download of the metrics may take a while.