Fig. 5.
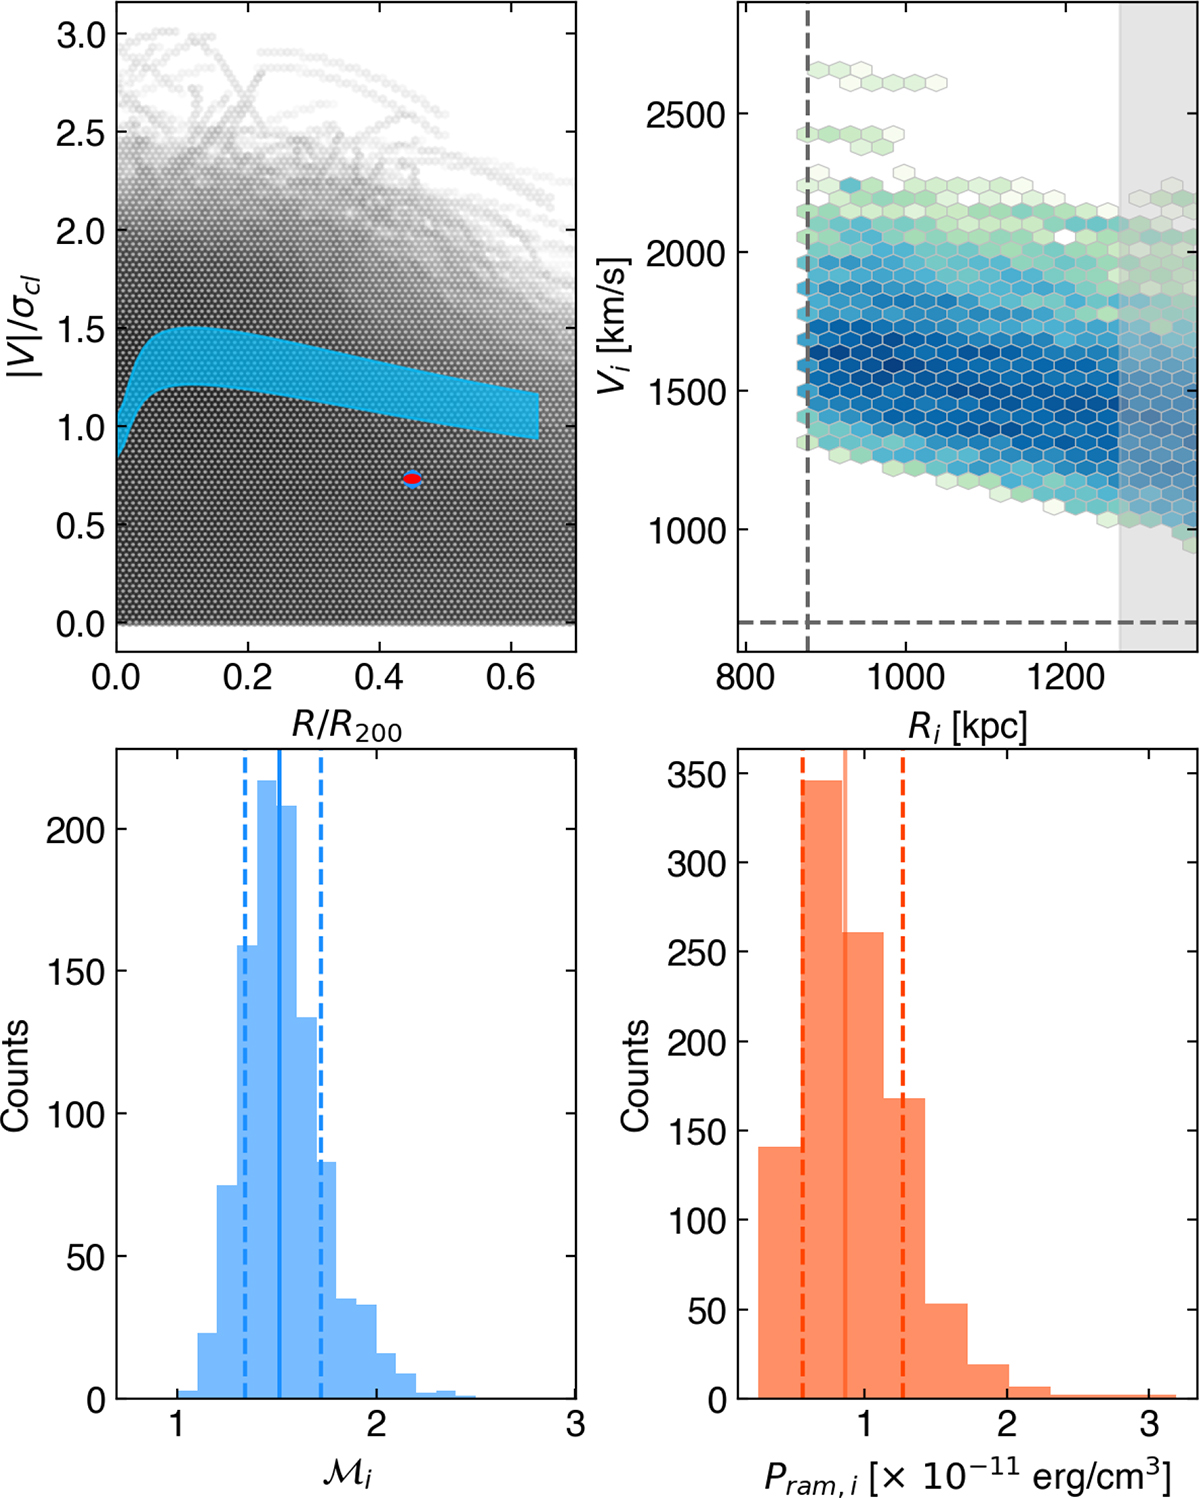
Download original image
Outcomes of the Monte Carlo analysis for JO147. Top: Simulated orbits projected on the phase-space plane. The red dot shows the projected phase-space coordinates for JO147, and the blue line indicates the corresponding ICM sound speed profile (left) and 2D Distribution of the Vi–Ri pairs associated with the projected JO147 coordinates. The dashed lines indicate the projected coordinates of JO147, and the shaded area covers the rejected Vi–Ri solutions (right). Bottom: ℳi (left) and Pram, i (right) distributions. The vertical lines indicate the median and the 16th and 84th percentiles.
Current usage metrics show cumulative count of Article Views (full-text article views including HTML views, PDF and ePub downloads, according to the available data) and Abstracts Views on Vision4Press platform.
Data correspond to usage on the plateform after 2015. The current usage metrics is available 48-96 hours after online publication and is updated daily on week days.
Initial download of the metrics may take a while.