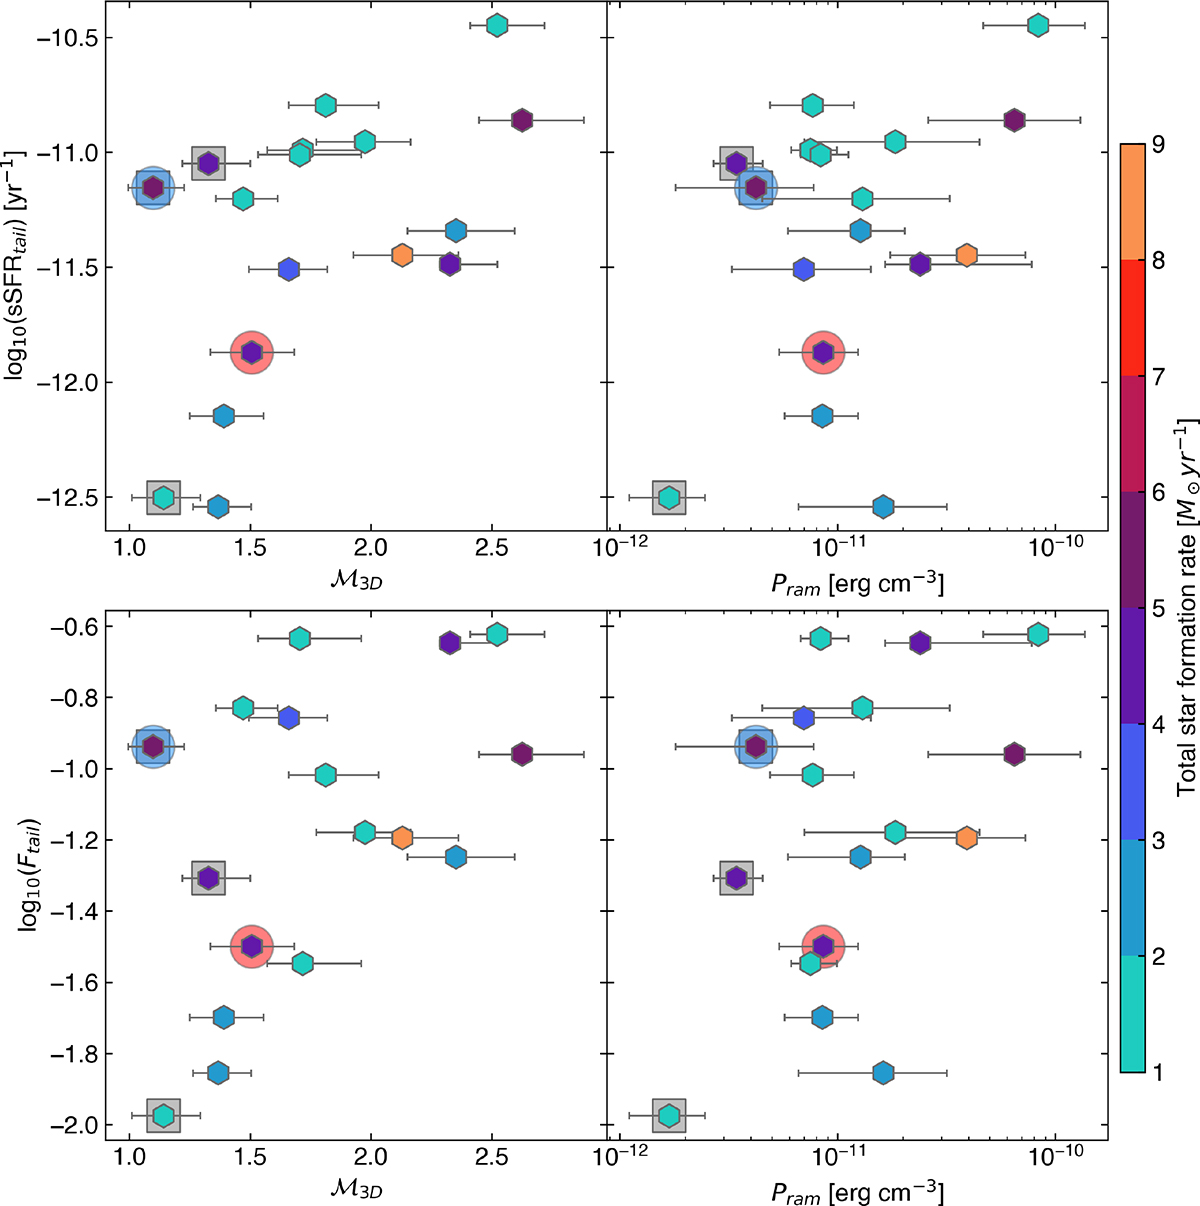
Fig. 7.
Download original image
Extraplanar star formation efficiency vs. dynamical properties of the GASP sample. Extraplanar specific star formation rate, log10(sSFRtail) (top), and star formation rate fraction, log10(Ftail) (bottom), vs. 3D Mach number, ℳ3D (left), and ram pressure, Pram (right, presented on a logarithmic scale for visual clarity). Each point is color coded based on its corresponding total star formation rate (Gullieuszik et al. 2020). JO147 and JO206 are marked with red and blue circles, respectively. Points marked with silver boxes may suffer from systematic ℳ3D underestimates (see Sect. 4.3).
Current usage metrics show cumulative count of Article Views (full-text article views including HTML views, PDF and ePub downloads, according to the available data) and Abstracts Views on Vision4Press platform.
Data correspond to usage on the plateform after 2015. The current usage metrics is available 48-96 hours after online publication and is updated daily on week days.
Initial download of the metrics may take a while.