Fig. 8.
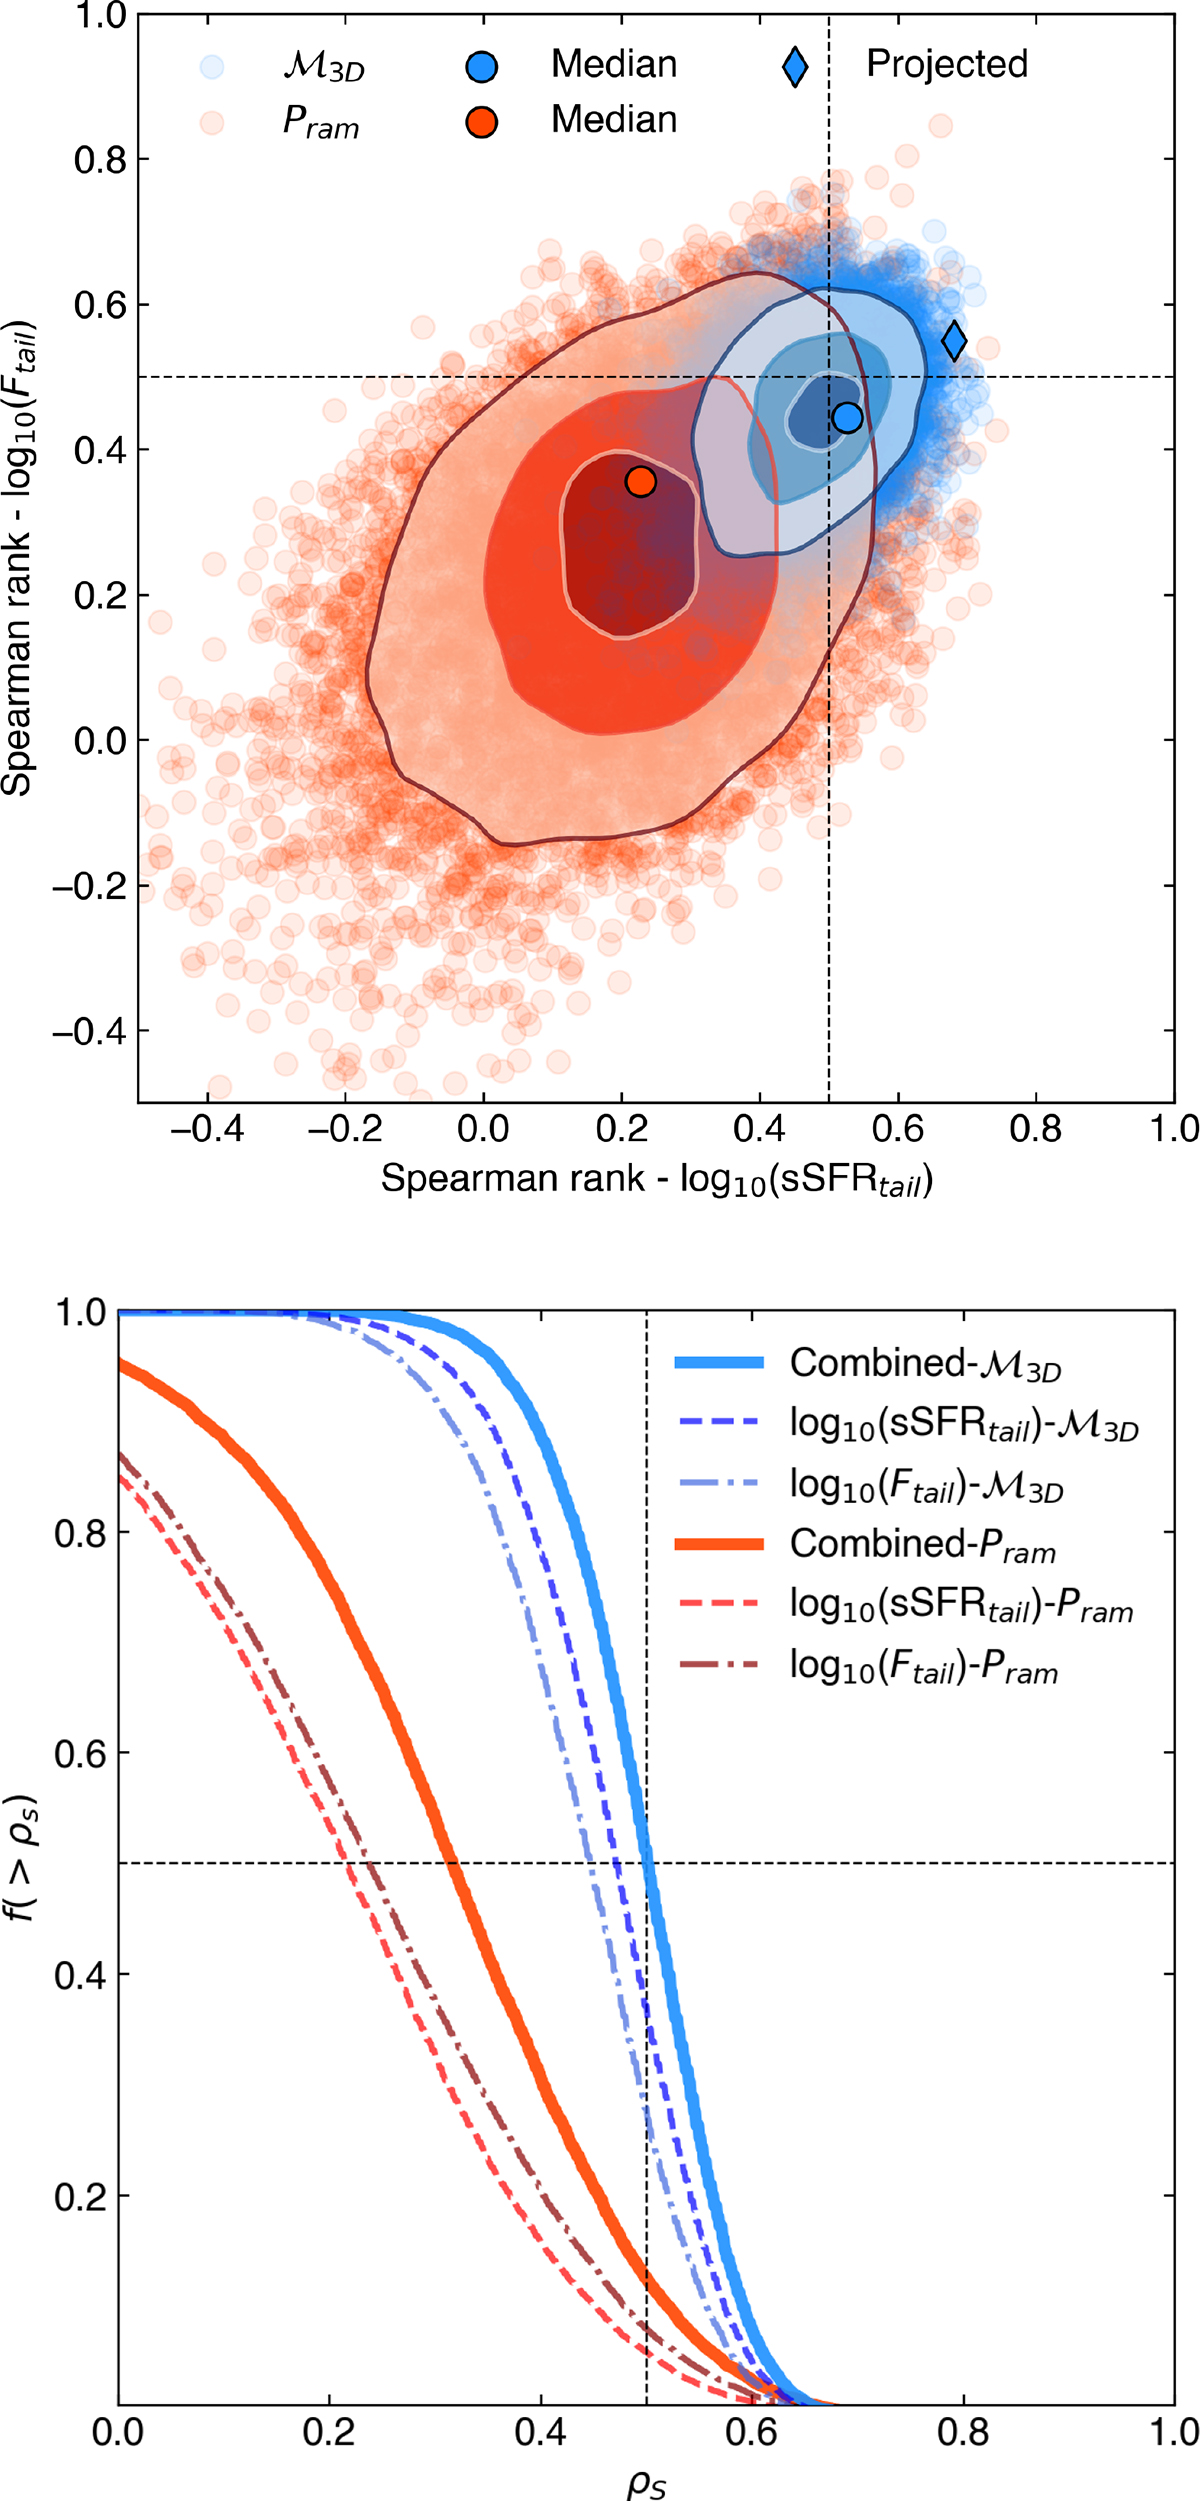
Download original image
Spearman rank distributions. Top: Spearman rank distributions derived for log10(sSFRtail) and log10(Ftail) when compared with ℳ3D (blue) and Pram (red). Each point shows the ranks derived for different realizations of the ℳ3D and Pram series. The contours indicate the 2D probability density levels of 0.16, 0.5, and 0.84. The dashed black lines indicate the ρs = +0.5, corresponding to an existing positive correlation between the two quantities. The black-outlined points indicate the Spearman ranks measured from the median values reported in Fig. 7. For reference, the blue diamond indicates the correlation rank from the “projected” ℳ (Fig. 4); Bottom: Fraction of realizations with a Spearman rank higher than ρs for ℳ3D (blue) and Pram (red). The solid lines show the combined fractions of log10(sSFRtail) and log10(Ftail), and the dashed and dot-dashed lines show the fractions for the individual quantities. The dashed black lines indicate the 0.5 levels on the corresponding axis.
Current usage metrics show cumulative count of Article Views (full-text article views including HTML views, PDF and ePub downloads, according to the available data) and Abstracts Views on Vision4Press platform.
Data correspond to usage on the plateform after 2015. The current usage metrics is available 48-96 hours after online publication and is updated daily on week days.
Initial download of the metrics may take a while.