Fig. 1.
Download original image
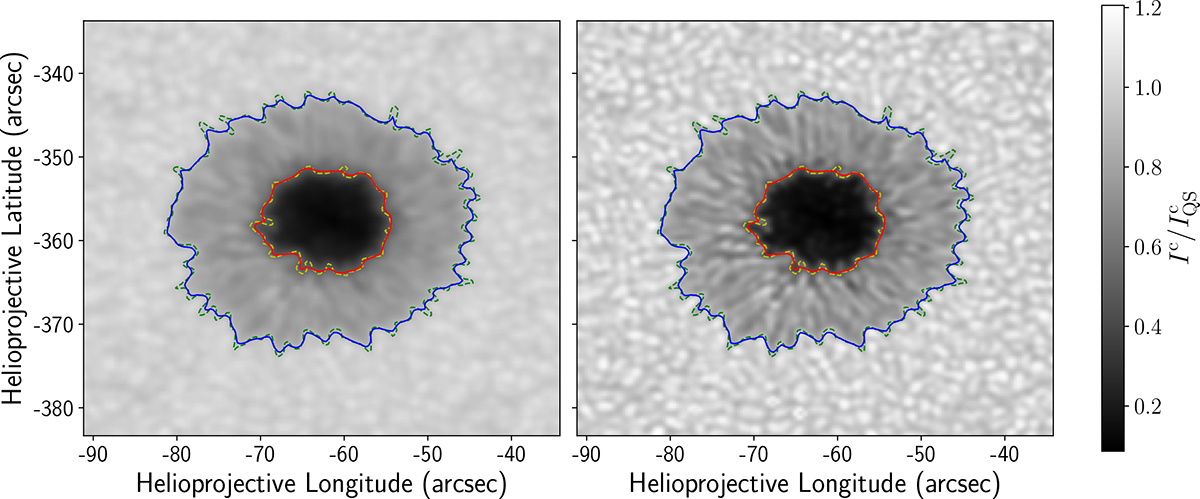
Comparison of the original HMI continuum intensity (left) and its deconvolved version (right) for NOAA AR 11084 (HARP 71 dataset), observed on 2010 July 2 at 04:00:00 UT. The red and blue contours correspond to 0.5 and 0.9 of the original continuum intensity, respectively, and the dashed yellow and green contours indicate the same levels in the deconvolved image. The colour bars are identical in the two panels.
Current usage metrics show cumulative count of Article Views (full-text article views including HTML views, PDF and ePub downloads, according to the available data) and Abstracts Views on Vision4Press platform.
Data correspond to usage on the plateform after 2015. The current usage metrics is available 48-96 hours after online publication and is updated daily on week days.
Initial download of the metrics may take a while.