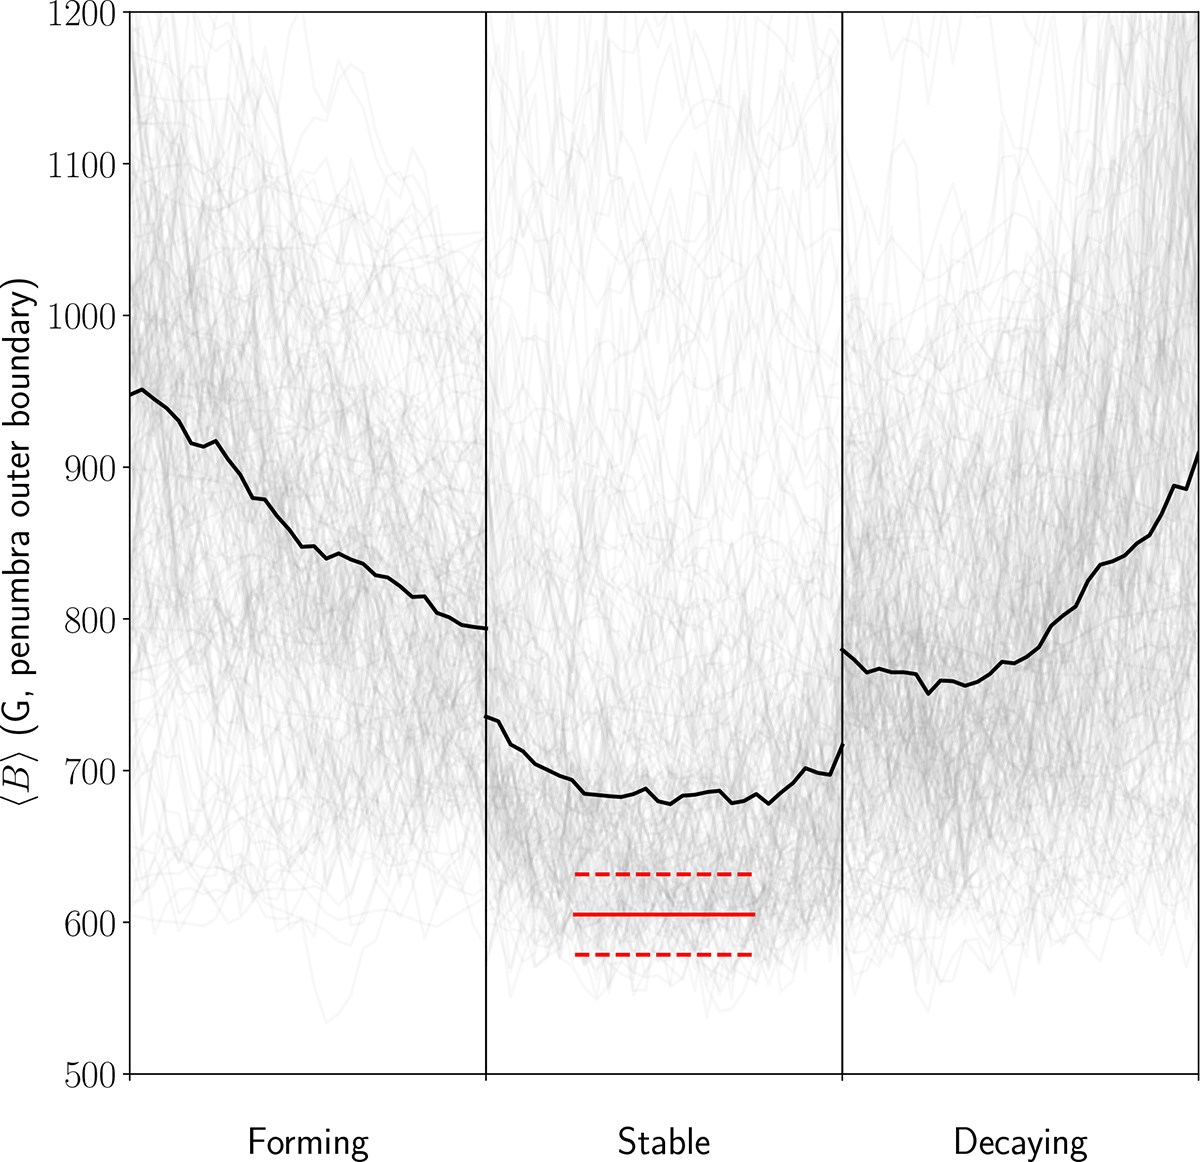
Fig. 3.
Download original image
Time series of individual ⟨B⟩ measurements for the three evolutionary phases. The thick black curve shows the phase-wise median. The solid and dashed red lines indicate the peak and standard deviation of the Gaussian fit to the high-stability subset, respectively (black curve in Fig. 2). The vertical black lines separate different phases.
Current usage metrics show cumulative count of Article Views (full-text article views including HTML views, PDF and ePub downloads, according to the available data) and Abstracts Views on Vision4Press platform.
Data correspond to usage on the plateform after 2015. The current usage metrics is available 48-96 hours after online publication and is updated daily on week days.
Initial download of the metrics may take a while.