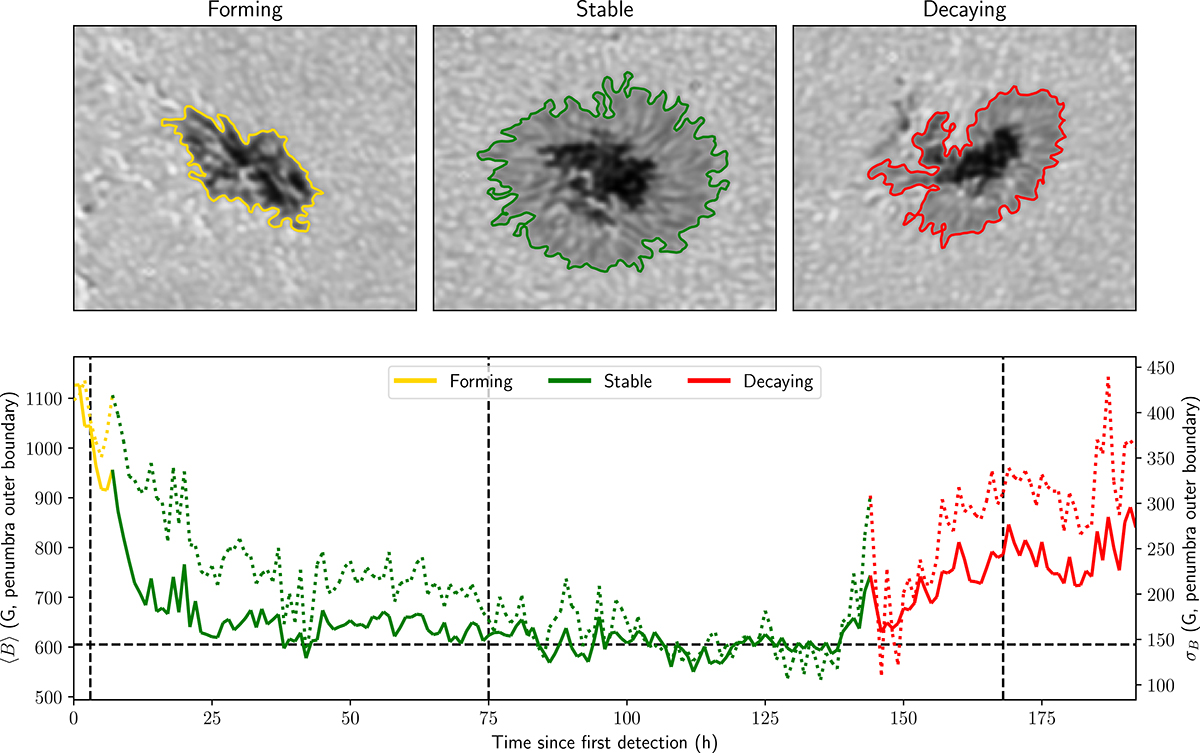
Fig. 5.
Download original image
Temporal evolution of sunspot NOAA AR 11250 (HARP 712 dataset). Top: Snapshots of the continuum intensity selected near the midpoint of each evolutionary phase with Ic/IQSc = 0.9 contours. Bottom: Time series of the mean magnetic field strength ⟨B⟩ (solid line) and the field standard deviation (dotted line). The phase is indicated by the line colours. The sunspot exhibits a clear forming, stable, and decaying phases with ⟨B⟩ approaching the invariant value (dashed black line) during the fully developed stable interval. The vertical dashed black lines mark the times corresponding to the snapshots shown in the top row.
Current usage metrics show cumulative count of Article Views (full-text article views including HTML views, PDF and ePub downloads, according to the available data) and Abstracts Views on Vision4Press platform.
Data correspond to usage on the plateform after 2015. The current usage metrics is available 48-96 hours after online publication and is updated daily on week days.
Initial download of the metrics may take a while.