Open Access
Fig. 2.
Download original image
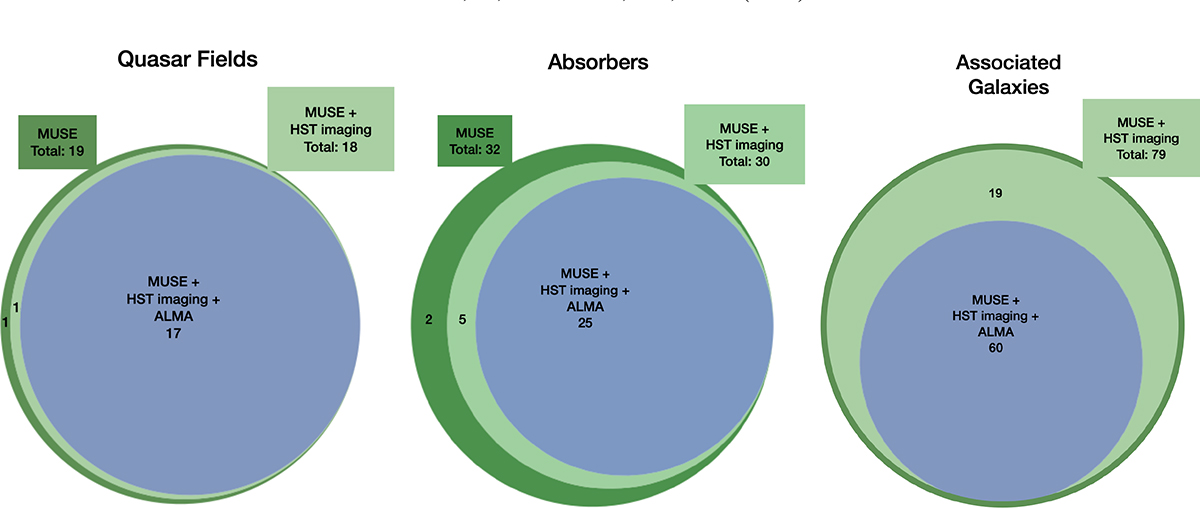
MUSE-ALMA Haloes number of targets covered by various observing campaigns. This figure provides a graphical viewing of the numbers listed in Table 1. The left, middle, and right panels illustrate the number of quasar fields, quasar absorbers, and galaxies associated with the quasar absorbers observed by each facility.
Current usage metrics show cumulative count of Article Views (full-text article views including HTML views, PDF and ePub downloads, according to the available data) and Abstracts Views on Vision4Press platform.
Data correspond to usage on the plateform after 2015. The current usage metrics is available 48-96 hours after online publication and is updated daily on week days.
Initial download of the metrics may take a while.