| Issue |
A&A
Volume 708, April 2026
|
|
|---|---|---|
| Article Number | A146 | |
| Number of page(s) | 18 | |
| Section | Extragalactic astronomy | |
| DOI | https://doi.org/10.1051/0004-6361/202558645 | |
| Published online | 03 April 2026 | |
MUSE-ALMA Haloes
XIV. The ALMA Large Programme Data Release
1
European Southern Observatory, Karl-Schwarzschild-Str. 2, 85748 Garching near Munich, Germany
2
Aix Marseille Univ., CNRS, LAM, (Laboratoire d’Astrophysique de Marseille), UMR 7326, 13388 Marseille, France
3
Max-Planck-Institut für Extraterrestrische Physik (MPE), Giessenbachstrasse 1, 85748 Garching, Germany
4
Centre for Astrophysics and Supercomputing, Swinburne University of Technology, Hawthorn, Victoria 3122, Australia
5
CSIRO Space and Astronomy, PO Box 1130, Bentley, WA 6102, Australia
6
Leibniz-Institut für Astrophysik Potsdam (AIP), An der Sternwarte 16, 14482 Potsdam, Germany
7
Max-Planck-Institut für Astrophysik (MPA), Karl-Schwarzschild-Str. 1, 85741 Garching, Germany
8
Observatoire Astronomique de Strasbourg – UMR 7550, 11 rue de l’Université, 67000 Strasbourg, France
9
Department of Physics and Astronomy, University of South Carolina, Columbia, SC 29208, USA
★ Corresponding author: This email address is being protected from spambots. You need JavaScript enabled to view it.
Received:
18
December
2025
Accepted:
19
February
2026
Abstract
The interactions between gas and galaxies are of paramount importance to our understanding of structure formation. A fundamental element of such baryon cycle studies is a complete census of the condensed matter (stars and cold gas) in both galaxies and their immediate surroundings, the so-called circumgalactic medium. Of particular importance are the processes of converting molecular gas into stars and deciphering whether this < 100 K gas is tracing gas flows. The MUSE-ALMA Haloes survey assembled probes of the neutral atomic gas H I, ionised gas, and stellar component for a sample of 79 z ∼ 0.5 galaxies. This was achieved by combining absorption-line spectroscopy of background quasars with a projected impact parameter as low as 5 kpc and as high as 250 kpc to probe the low-density circumgalactic gas with emission-line tracers of both ionised gas and stars. This paper presents the Large Programme observational setup and releases the data characterising the molecular phase of some of the MUSE-ALMA Haloes targets so as to reach a complete census of their condensed baryons. ALMA’s unique millimetre coverage and high sensitivity are ideal for characterising the CO emission of these z ∼ 0.5 H I-selected galaxies. By measuring the molecular mass, kinematics, gas flows, and gas fractions, this project (i) quantifies the role of molecular gas in H I-rich galaxies, (ii) characterises the molecular phase of gas flows from morpho-kinematics analyses, and (iii) establishes a census of the condensed baryons in the interstellar and circumgalactic media. Ultimately, these results will provide unique insights into the baryon cycle – a crucial component of galaxy formation.
Key words: galaxies: abundances / galaxies: evolution / galaxies: formation / galaxies: high-redshift / galaxies: kinematics and dynamics / quasars: absorption lines
© The Authors 2026
 Open Access article, published by EDP Sciences, under the terms of the Creative Commons Attribution License (https://creativecommons.org/licenses/by/4.0), which permits unrestricted use, distribution, and reproduction in any medium, provided the original work is properly cited.
This article is published in open access under the Subscribe to Open model. This email address is being protected from spambots. You need JavaScript enabled to view it. to support open access publication.
1. Introduction
The mass-energy census of the cosmos is now well constrained. The vast majority of the Universe’s constituents are in the form of dark energy and dark matter, which are subjects of major research. The total amount of normal baryonic matter has been well measured by at least three independent techniques probing the Universe at different epochs: small temperature fluctuations in the cosmological background spectral energy distribution (Planck Collaboration XIII 2016), abundance of heavy elements produced during the Big Bang nucleosynthesis (Cooke et al. 2014), and dispersion measures of fast radio bursts (Macquart et al. 2020). However, only a minority of the remaining normal baryonic matter can be probed by the observations of starlight within galaxies (Shull et al. 2012; Nicastro et al. 2018; Mathur et al. 2021; Das et al. 2021), because a major reservoir of the baryons are in the form of gas (Péroux & Howk 2020).
The gas is of prime interest since it flows along the cosmic filaments and feeds the formation of galaxies, groups, and clusters. Indeed, galaxy formation is fed by inflows of gas from the intergalactic medium (IGM) (Dekel et al. 2009). Baryons from the cosmic web accrete onto galaxies, where they cool into a dense atomic and later molecular phase, which acts as the fuel for star formation. Once stars are formed, galaxies interact with the IGM by polluting it with ionising photons and chemical elements formed in stars and supernovae through galactic winds (Pettini 2003; Shull 2014; Danforth et al. 2016). Understanding the drivers of the cold gas accretion rate onto galaxies, the efficiency of converting molecular gas into stars and the role of outflowing gas in preventing the infall of new accreting material has garnered increasing importance in galaxy formation studies. Therefore, galaxy evolution is strongly driven by the physical processes by which the gas flows into and outwards of the galaxy, is converted into stars, and either ejected out through winds or recycled to form a new generation of stars. In particular, the condensed forms of this gas, notably the cold gas traced by molecular hydrogen, provide the ultimate reservoir of fuel for forming stars. This cosmic baryon cycle describes the motion and phase transformation of the baryons (Tacconi et al. 2020; Walter et al. 2020). These global processes take place in the immediate surrounding of galaxies, thus constituting the so-called galaxy baryon cycle (Péroux & Howk 2020).
The sites of these multi-phase gas exchanges are the immediate surroundings of galaxies, that is, the circumgalactic medium (CGM) (Tumlinson et al. 2017; Peroux & Nelson 2024). With the advent of precursors of the future Square Kilometre Array Observatory (SKAO) like MeerKAT (Jonas & MeerKAT Team 2016) or ASKAP (Johnston et al. 2008), surveys aim to detect the extended reservoir of low-density H I emission around galaxies in the local Universe that are likely responsible for the cold gas accretion. For instance, the MHONGOOSE H I observation on MeerKAT (de Blok et al. 2024) is the deepest survey ever carried out at 21 cm, spanning 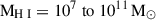 . One of the key outcomes of MHONGOOSE is the paucity of low-density H I emission in the atomic gas around galaxies (Marasco et al. 2025; Veronese et al. 2025), in contrast with expectations from cosmological hydrodynamical simulations. Such a study demonstrates the need for even more sensitive observations with the SKAO to reach densities at least an order of magnitude deeper to search for large amounts of H I gas in isolated clouds, dwarf galaxies, or potential cosmic filaments of neutral hydrogen (de Blok et al. 2024).
An alternative powerful tool to study the cooler phase of that gas is provided by absorption lines in the spectra of background quasars as it enables us to study regions of under-dense gas (Morris et al. 1993; Tripp et al. 1998). Indeed, in these quasar absorbers, the minimum gas density that is probed is set by the brightness of the background source, and it is thus independent of the redshift of gas studied. Thus, quasar absorption lines have proven invaluable for probing the neutral atomic gas of foreground galaxies that would otherwise be too diffuse to detect (Péroux et al. 2017; Augustin et al. 2018). Recently, 3D integral field spectroscopy, producing data cubes where each pixel on the image has a spectrum, has proven to be a true game-changer to detect ionised gas in emission in the CGM of these foreground galaxies. For example, the guaranteed-time-observations programme MEGAFLOW used Mg II absorbers in 22 quasar fields to characterise the geometry, kinematics, and impact of gas flows around star-forming galaxies (Bouché et al. 2025). A primary finding of MEGAFLOW is that the cool halo gas traced by Mg II absorption is not isotropically distributed around galaxies. Instead, it shows a strong bimodal distribution in the azimuthal angle relative to the galaxy’s major axis (Schroetter et al. 2019). By assuming that absorbers near the minor axis probe outflows (Péroux et al. 2020) and making assumptions on N(H I), MEGAFLOW has placed constraints on the properties of gas flows, including the mass loading factor (the ratio of the mass-ejection rate in the wind to the galaxy’s star formation rate). MUSEQuBES is another Guaranteed Time Observations programme that uses MUSE to study the CGM of galaxies (Muzahid et al. 2020; Dutta et al. 2024). MUSEQuBES uses other metal tracers, namely O VI absorption, to study the highly ionised CGM around low-mass dwarf galaxies at lower redshifts (Dutta et al. 2024). This gas is found to be gravitationally bound to the galaxies, and the averaged O VI column density around low-mass galaxies (M★ < 108.7) is significantly lower than that around more massive galaxies (Dutta et al. 2025a,b). A significant portion of the survey focuses on characterising the CGM of Lyα emitters at a redshift of z ∼ 3.3, which additionally made it possible to estimate constraints on the H I column density of the absorbers from ground-based observations. The survey found significant excess H I and C IV absorption in the CGM of these Lyα emitters, extending out to at least 250 pkpc, which corresponds to about seven times the virial radii of these galaxies (Muzahid et al. 2021). A key finding is the strong influence of the galactic environment on the CGM. Lyα emitters, which are parts of pairs or groups, show significantly stronger absorption and a higher gas-covering fraction compared to isolated galaxies (Banerjee et al. 2023, 2025). The MAGG survey instead investigates the connection between optically thick gas and galaxies in the early Universe, specifically at redshifts z = 3–4 (Lofthouse et al. 2020, 2023; Galbiati et al. 2024). The survey has shown that Lyα emitters are situated within cosmic structures that contain multi-phase gas, varying in composition and temperature (Galbiati et al. 2024). The properties of these gas phases are strongly influenced by the large-scale galaxy environment, with the strength and kinematics of the gas correlating positively with the number of associated galaxies (Galbiati et al. 2024). To benefit from the information provided by H I at lower redshift, another survey dubbed CUBS uses absorption-line spectroscopy of 15 UV-bright background quasars observed with COS and WFC3 to map the diffuse gas in and around galaxies at redshifts of z < 1 with MUSE. CUBS has shown that Lyman limit systems (LLSs) originate in diverse settings, including the haloes of low-mass dwarf galaxy pairs, the extended gaseous discs of star-forming galaxies, the vicinity of massive quiescent galaxies, and within galaxy groups (Chen et al. 2020). Recently, signatures of inflows and outflows have also been reported from emission studies also using the KCWI instrument on Keck (Guo et al. 2023; Pessa et al. 2024; Erb et al. 2023).
Complementary to these efforts, recent years have also seen the development of similar approaches at millimetre wavelengths. Despite its modest primary beam, ALMA can be seen as a 3D spectrograph since it provides frequency and spatial information simultaneously. On top of the early efforts of the MUSE-ALMA Haloes survey itself (Klitsch et al. 2018; Péroux et al. 2019; Kanekar et al. 2018) focused on the nature of galaxies that give rise to high-metallicity damped Lyman-α (DLA) absorption systems at intermediate redshifts (z = 0.5–0.8) by searching for carbon monoxide (CO) emission, which is a tracer of molecular gas, from seven of these absorption-selected galaxies. The authors reported high molecular gas fractions, the ratio of molecular gas mass to the total baryonic mass, and low star formation rate (SFR) in the five systems they detect. Interestingly, Klitsch et al. (2021) reported a high detection rate in the detection of CO emission in the fields of six H2-bearing absorbers. Again, they find that the majority of the H2 absorbers are associated with multiple galaxies rather than single, isolated galactic haloes. Recently, Neeleman et al. (2025) presented the results of a survey studying galaxies associated with damped Lyα absorbers (DLAs) at a redshift of around four. The study found that the ability to detect the host galaxies of these DLAs in [C II] emission is strongly dependent on the metallicity of the absorbing gas itself. The detection rate is high (71%) for DLAs with a metallicity of [M/H] > −1.5, but zero for those with lower metallicities. Otherwise, they find that the detected galaxies have properties similar to typical star-forming galaxies at this high redshift.
By combining 3D information from both optical and millimetre wavelengths, the MUSE-ALMA Haloes survey builds on both these lines of enquiry. With the additional high-spatial-resolution imaging enabled by space missions, the stellar continuum for the same objects is now robustly traced despite the light contamination from the bright background quasar (Augustin et al. 2018; Karki et al. 2023; Augustin et al. 2024; Karki et al. 2026). Without a quantitative description of the molecular phase, however, one cannot fully understand the baryon cycle.
In this context, this paper introduces the ALMA Large Programme component of the MUSE-ALMA survey, the goal of which is to probe the molecular phase of an otherwise well-studied sample of z ∼ 0.5 galaxies. The overarching objective of the MUSE-ALMA Haloes project is to use multi-wavelength information to probe the physical processes by which gas is transformed into stars through the baryon cycle. This paper is organised as follows. In Sect. 2, we describe the selection of the MUSE-ALMA Haloes targets. Section 3 presents the multi-wavelength complementary datasets and the physical properties they constrain. Section 4 describes the ALMA observations, while Sect. 5 specifically details ALMA Large Programme survey design, describes the observational setup, and an extensively reports on the data reduction processes. Section 6 introduces the release of the resulting data products, while Sect. 7 summarises the science goals of the programme. Finally, Sect. 8 provides our key conclusions. Throughout this paper, we use H0 = 70 kms−1 Mpc−1, ΩM = 0.3, and ΩΛ = 0.7.
2. The MUSE-ALMA Haloes primary-target selection
The MUSE-ALMA Haloes survey is a multi-facility programme conducted through various distinct observing campaigns over the years. Several similar efforts have come to fruition recently. This includes the impressive PHANGS, which is a large, multi-wavelength observational programme designed to build a comprehensive dataset for studying star formation and the ISM across a representative sample of nearby spiral galaxies (Schinnerer et al. 2019; Lang et al. 2020; Leroy et al. 2021). By combining data from ALMA, MUSE, HST, and now JWST, PHANGS enables a multi-phase, multi-scale investigation of the entire star formation cycle (Barnes et al. 2023; Lee et al. 2023). Likewise, MAUVE is a MUSE and ALMA multi-wavelength programme designed to investigate how the cluster environment shapes the gas–star formation cycle in galaxies falling into the Virgo Cluster (Watts et al. 2024). MAUVE aims to characterise the ISM, stellar populations, and star formation activity in 40 late-type Virgo Cluster galaxies at various stages of infall. The upcoming KILOGAS survey, which combines maps at 1 kpc resolution in a sample of over 400 galaxies with available optical integral field spectroscopy from the MaNGA and SAMI surveys, provides resolution-matched SFR, metallicity, and stellar maps, as well as ionised gas and stellar kinematics. In the future, with the availability of new channels across observatories1, such a multi-wavelength approach is likely to be key to unveiling multi-phase physics in various galactic media.
The MUSE-ALMA Haloes survey uniquely provides accurate information on the H I content and metallicity of the CGM of its targets. Because of the asynchronous nature of the proposing cycles, the target selection of the MUSE-ALMA Haloes sample has been evolving as new information has become available.
In a nutshell, the quasar absorbers of the MUSE-ALMA Haloes survey were selected on HST/UV spectroscopy to have the H I column density, log [N(H I)/cm−2] > 18, and zabs < 0.85. The first of these two elements of the selection is key to enabling robust absorption-metallicity measurements (Halley et al. 2026) and gas-mass estimates in galactic flows (Rahmani et al. 2018b). Indeed, we emphasise that accurate knowledge of the H I column density in absorption is key to precisely measuring the neutral gas metallicity and assessing the potential gas ionisation correction (Halley et al. 2026). In addition, N(H I) is a key component of the estimate of the mass-loading factor (Bouché et al. 2013; Schroetter et al. 2015). This selection criterion is added to those of other surveys focusing on metal lines (Bouché et al. 2025; Dutta et al. 2025a).
On the other hand, the redshift criterion of the target selection enables both accurate redshift measurements and kinematic reconstruction (Szakacs et al. 2021; Weng et al. 2023a). This redshift range enables the robust determination of both the systemic redshift based on narrow emission lines (as opposed to the resonant Lyα line), as well as the SFR and emission metallicity of these galaxies based on rest-frame optical emission diagnostics. Furthermore, at low redshift, the larger apparent size and increased surface brightness enable kinematic reconstruction of the objects. Finally, the redshift range set to be zabs < 0.85 complements other efforts at z > 3 (Muzahid et al. 2021).
At the start of the survey, the sample resulting from this selection comprises 32 individual absorbers in 19 distinct quasar fields (i.e. multiple absorbers per quasar spectra), which are dubbed primary targets. Figure 1 presents this number of targets in context of similar surveys targeting quasar absorbers with known N(H I) column densities as a function of redshift (Muzahid et al. 2020; Chen et al. 2020; Lofthouse et al. 2023; Erb et al. 2023; Kanekar et al. 2018; Klitsch et al. 2018; Neeleman et al. 2025). On top of the sizeable sample, the MUSE-ALMA Haloes survey uniquely combines 3D observations at optical and millimetre wavelengths to enable studies of the multi-phase gas.
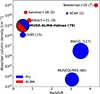 |
Fig. 1. MUSE-ALMA Haloes surveys in context of other comparable efforts. This figure reports surveys targeting quasar absorbers with known N(H I) column densities as a function of redshift (this work; Muzahid et al. 2020; Chen et al. 2020; Lofthouse et al. 2023; Erb et al. 2023; Kanekar et al. 2018; Klitsch et al. 2021; Neeleman et al. 2025). IFU refers to both VLT/MUSE and Keck/KCWI. Symbol sizes are proportional to the number of targets in each survey. On top of the sizeable sample, the MUSE-ALMA Haloes survey uniquely combines 3D observations at optical and millimetre wavelengths to enable studies of the multi-phase gas. |
Archival and new proprietary observations with VLT and Keck provide additional optical spectroscopy of the background quasars. All but one of the quasar spectra are observed at high-spectral resolution. The exception is Q1110+0048 (which contains one absorber) due to the lack of completion of the UVES PI-run. This makes a sample of 18 quasar fields, with 31 absorbers.
All 19 fields were followed up with VLT/MUSE to detect, in emission, the galaxies associated with the absorbers with impact parameters ranging from b = 0 kpc for emission-line objects (thanks to spectral-PSF subtraction; see Péroux et al. 2019) to ∼250 kpc for all galaxies. Seventy-nine such emitters were detected within ±500 km/s of the absorber redshift (Weng et al. 2023b). An HST medium broad-band-imaging programme characterised the stellar content of all these objects, except for one quasar field (Q0058+0019 with 2 absorbers but no galaxies identified in the VLT/MUSE observations). This led to a sample of 18 quasar fields, with 30 absorbers and the full 79 associated galaxies. The ALMA observations spread over several cycles to cover all but one of these fields (Q2353−0028, which is found to have no associated galaxies within 500 km/s in the MUSE observations). Because of the restricted primary beam, however, not all the known associated galaxies detected in MUSE are targeted with ALMA. The final sample thus contains 17 quasar fields, together containing 25 absorbers. These absorbers are associated with 60 distinct galaxies. Thirty-nine of these galaxies have been targeted by the ALMA Large Programme presented in this paper. These samples are listed in Table 1 and illustrated by the Venn diagrams displayed in Fig. 2. In addition to the ‘primary targets’, a total of 3658 galaxies were detected in the MUSE and HST datasets and are the subject of parallel studies (Péroux et al. 2022).
 |
Fig. 2. MUSE-ALMA Haloes number of targets covered by various observing campaigns. This figure provides a graphical viewing of the numbers listed in Table 1. The left, middle, and right panels illustrate the number of quasar fields, quasar absorbers, and galaxies associated with the quasar absorbers observed by each facility. |
MUSE-ALMA Haloes number of targets covered by various observing campaigns.
3. The MUSE-ALMA Haloes multi-facility datasets
In the MUSE-ALMA Haloes survey, several distinct observational campaigns provide information on the multi-phase interstellar and circumgalactic media of the galaxy sample. Indeed, the project combines absorption and emission data probing the atomic, molecular, and ionised gas, as well as stellar populations in these z ∼ 0.5 objects. This section reviews these datasets, which are complementary to the ALMA observations, and the physical properties they constrain. Table A.1 lists the MUSE-ALMA Haloes survey publications to date. The overall approach is schematically illustrated by Fig. 3, a sketch that was partially AI-generated with FIGURELABS2.
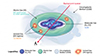 |
Fig. 3. Sketch of multi-phase circumgalactic and interstellar media. MUSE-ALMA Haloes uniquely probes the various component of the condensed baryonic matter as indicated in the labels: neutral molecular and atomic and ionised gas and stellar components of galaxies. This is done through various observing programmes gathering data from multi-frequency facilities as indicated by the colours. |
3.1. Atomic gas
3.1.1. Neutral hydrogen gas from space-based UV spectroscopy
Each background quasar has archival HST/UV spectroscopy providing reliable N(H I) measurements of the strong intervening low-redshift absorbers with log [N(H I)/cm−2] > 18. The observations were undertaken with either HST/FOS (Harms & Fitch 1991), COS (Green et al. 2012) or STIS (Kimble et al. 1998). The H I column-density measurements quantify the neutral phase of the circumgalactic gas at an impact parameter of the associated galaxies and provides accurate absorption redshift measurements. For lower column densities, where the gas could be partly ionised, photoionisation models with the CLOUDY software enabled robust estimates of the ionisation fraction of the gas (Halley et al. 2026). The resulting quantities are provided in Columns 2 and 3 of Table B.1, and their distributions are plotted in the left and central panels of Fig. 4.
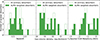 |
Fig. 4. Properties of primary targets observed with ALMA. Left panel: Redshift distribution of 32 quasar absorbers making up the primary sample of MUSE-ALMA Haloes survey. The filled histogram (green) displays the redshift distribution of the 25 intervening absorbers targeted by ALMA observations. Middle panel: Atomic hydrogen gas column-density distribution of these strong absorbers. The selection criterion imposes the cut at log [N(H I)/cm−2] > 18. Right panel: Neutral gas absorption metallicity measured from archival and new VLT and Keck observations after ionisation and dust correction by Halley et al. (2026). The metallicity is the abundance of all metals and is expressed as [M/H]=log{N(M)/N(H)} − log{N(M)/N(H)}⊙. |
3.1.2. Gas-phase metallicity from ground-based optical spectroscopy
Complementary to space-based HST/UV spectroscopy, ground-based spectroscopy of the background quasars provides additional information on the abundance, element ratio, and dust properties of the neutral circumgalactic gas. A number of existing spectra are available through the VLT and Keck archives as displayed in the last column of Table 1 of Péroux et al. (2022). Recently, most of the remaining quasars were observed with VLT/UVES spectroscopy as part of a new programme (ID: 113.A-0369; PI: C. Peroux).
When available, archival Keck/hiRES, VLT/UVES, and VLT/X-Shooter data were used. The high-resolution quasar spectra are used to search for new quasar absorbers beyond the primary targets. Sixteen such systems were discovered, so a total of 48 absorbers with N(H I) measured are now available from the MUSE-ALMA Haloes survey. These will be presented in a forthcoming paper (Halley et al. 2026). In addition, the quasar spectra were used to measure the metal-line column densities of ions including FeII, SiII, SiIII, SiIV, dust-free ZnII, and CIV from Voigt profile fitting and performing ionisation and dust-depletion corrections where needed (Halley et al. 2026). These high-resolution data characterise the neutral circumgalactic gas metallicity. Early results from the archival data (Weng et al. 2023b) indicate that the metallicity of associated galaxies is typically larger than the absorber metallicity, which decreases at larger impact parameters. The resulting absorption metallicities are provided in Column 4 of Table B.1, and their distribution is plotted in the right panel of Fig. 4.
3.2. Galaxy emission properties from optical 3D spectroscopy
Three-dimensional integral field units (IFUs), which produce data cubes where each pixel on the image has a spectrum, have provided a powerful technique for associating quasar absorbers with galaxies. Building on early efforts with near-infrared IFU VLT/SINFONI (Bouché et al. 2007; Péroux et al. 2011a,b, 2013), the potential of this technique in the study of the CGM of intervening galaxies has grown with the availability of large optical IFUs such as VLT/MUSE and Keck/KCWI (Bouché et al. 2016; Péroux et al. 2017; Zabl et al. 2019; Lofthouse et al. 2020; Nielsen et al. 2020). Over several observing periods, the MUSE-ALMA Haloes survey has used the VLT/MUSE in particular to identify 79 galaxies responsible for the strong z ∼ 0.5 quasar absorbers making up the primary targets.
By detecting the galaxies in emission, it is possible to connect the circumgalactic gas seen in absorption with ionised gas detected in emission. Indeed, the lower density extended circumgalactic gas seen in absorption can then be connected with the higher density ionised gas detected in emission and likely located closer to or in the galaxies. Weng et al. (2023b) used the measurements of the redshifts and impact parameters (provided in Columns 5 and 6 of Table B.1) with respect to the background quasars of the 79 detected galaxies to statistically map the neutral circumgalactic gas around galaxies. This work also reports that N(H I) column density of the absorbers is anti-correlated with regard to the impact parameter (scaled by virial radius) of the nearest galaxy as expected from simulations. Weng et al. (2023b) additionally provided accurate estimates of the SFR and emission metallicities of the objects as reported in Cols. 7 and 9 of Table B.1 and plotted on the right and left panels of Fig. 5. Furthermore, Weng et al. (2023a) made use of the 3D spectroscopy to reconstruct the kinematics of the ionised gas and establish a connection with the circumgalactic gas probed in absorption. Together, these works report that 10% of absorbers are consistent with gas accretion, a third trace outflows, while the reminding systems are associated with gas in the galaxy disc, the intragroup medium, or possibly low-mass galaxies below the MUSE detection limit. For comparison, the MEGAFLOW survey contains 79 strong MgII absorbers with 86 associated galaxies. Assuming that absorbers near the minor axis probe outflows, Schroetter et al. (2019) reported 26 galaxy–quasar pairs suitable for studying winds (i.e. 30%). Keck/KCWI has also been used to study targeted galaxies with outflows (Chen et al. 2021; Erb et al. 2023). IFUs thus provide a key element in the probing of the baryon cycle in the MUSE-ALMA Haloes galaxies.
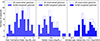 |
Fig. 5. Properties of associated galaxies. Left panel: Star formation rate distribution of the 79 galaxies making up the MUSE-ALMA Haloes survey. The filled histogram displays the SFR of galaxies observed with ALMA. Middle panel: Stellar mass distribution. Right panel: Ionised gas emission metallicity. |
3.3. Stellar properties from space-based broad-band imaging
An essential component of the MUSE-ALMA Haloes project is a Cycle 27 40-orbit medium HST programme (PI: C. Peroux) providing broad-band imaging with WFC3 on both the optical (UVIS) and infrared (IR) detectors for 18 quasar fields. We also used an additional 27 orbits of archival data recorded with WFPC2, making a total of 67 orbits dedicated to this part of the project. The properties of the objects (catalogues of sky positions, magnitudes in different bands) have been compiled and made publicly available (Péroux et al. 2022). We made a detailed analysis of these datasets, providing measurements of the stellar mass, dust content, age of the stellar population, as well as new constraints on their resolved morphology and large-scale environment. The observations also enabled the determination of the stellar masses of the associated galaxies through spectral-energy-distribution fits (Augustin et al. 2024) and detailed morphological analysis (Karki et al. 2023).
Karki et al. (2023) find that absorption-selected galaxies are consistent with the star formation main sequence of the global population. This work combines multi-wavelength information to demonstrate that more massive absorber counterparts are more centrally concentrated and are larger in size. Karki et al. (2023) further report that SFR surface densities of absorption-selected galaxies are higher than predicted by the Kennicutt–Schmidt relation for local galaxies, suggesting a higher star formation efficiency in the H I-rich galaxies. Augustin et al. (2024) establish that these objects probe a wide range of stellar masses: 8.1 < log(M*/M⊙) < 11.8, as illustrated in the middle panel of Fig. 5. The stellar mass of galaxy Q0454−220_4 was recently revised as M* = 1010.6 ± 0.1 M⊙. Given their star formation rates, most of these objects lie on the main sequence of galaxies.
Augustin et al. (2024) also confirmed a previously reported anti-correlation between the stellar masses and CGM hydrogen column density N(H I), indicating an evolutionary trend where higher mass galaxies are less likely to host large amounts of neutral atomic H I gas in their immediate vicinity up to 120 kpc. Recently, Karki et al. (2026) made use of HST deep imaging and MUSE 3D spectroscopy combined to study the low-surface-brightness extended emission around some of the galaxies associated with quasar absorbers. The authors find that galaxies exhibiting these features have enhanced star formation rates, specific star formation rates, SFR surface densities, emission metallicities, and dust reddening compared to galaxies without extended features. These findings point towards signatures of galaxy interactions and possible tidal streams. Karki et al. (2026) also note that features have higher sSFR and higher ionisation parameters but lower SFRs, lower emission metallicities, and lower dust reddening than their host galaxies, indicating a different physical origin of the media.
3.4. Molecular gas content from ALMA observations
Observations with ALMA’s millimetre coverage and high sensitivity have proven powerful to characterise the molecular emission of intervening galaxies. Over the last decade, CO at z < 4 and [CII] at higher redshift have been used to detect in emission galaxies associated with strong N(H I)-quasar absorbers. Neeleman et al. (2016, 2018), Augustin et al. (2018), Møller et al. (2018), Fynbo et al. (2018), Neeleman et al. (2020), Kanekar et al. (2020), and others report the ALMA observations of quasar absorbers in the z = 1–3 range. At the same time, the MUSE-ALMA Haloes survey undertook several ALMA runs to probe and analyse the molecular content of the associated galaxies. While Sect. 4 provides technical details of each of the ALMA datasets, this section summarises findings from early studies.
Klitsch et al. (2018) used multiple CO transitions and millimetre continuum detections to infer that the N(H I) absorber in the MUSE-ALMA Haloes Q0420−0127 quasar field traces either an outflow from the most massive galaxy or intragroup gas. Péroux et al. (2019) reported three CO detections associated with another MUSE-ALMA Haloes quasar absorber, finding long depletion timescales for the molecular gas and kinematics consistent with the ionised gas. Szakacs et al. (2021) presented observations of another six absorbers associated with nine galaxies, with multiple galaxies in overdensity being related to the absorbers (see also Klitsch et al. 2021). Szakacs et al. (2021) performed multi-phase kinematic studies, which show that the molecular and ionised gas phases are well aligned directionally and that the maximum rotation velocities closely match. Their results demonstrate that the two gas phases within the disk are strongly coupled. The authors also report evidence of infalling gas. Together, these studies evidence the power of combining multi-wavelength datasets to gain important information concerning the cool baryons in bounded structures at intermediate redshifts.
3.5. Astrometry across multi-wavelength datasets
A key component of the MUSE-ALMA Haloes survey is the multi-frequency observational imaging campaign conducted with VLT/MUSE, ALMA, and the HST. In order to compare these various datasets, it is essential for the observations to be recorded on a common astrometric frame. Specifically, detailed studies of the kinematics of multi-phase gas traced by MUSE and ALMA require accurate alignment (Péroux et al. 2019; Szakacs et al. 2021). Likewise, the search for CO emission in ALMA data based on MUSE and/or HST galaxy spatial position entailed precise astrometry (Augustin et al. 2018; Bollo et al. 2026). For all these reasons, we took advantage of the completion of the ALMA Large Programme to make a reappraisal of the astrometry across the various datasets presented in Sect. 3.
The absolute position accuracy of an ALMA image is theoretically limited by the accuracy of the phase calibrator position and the quality of the phase transfer during the observations. The latter depends on the weather conditions, the angle between the phase calibrator and the centre of the targeted field, the cadence of observations of the phase calibrator, and the level of errors in the antenna position measurements. For observations of the type of the ALMA MUSE Haloes survey, the position accuracy is less than the tabulated synthesised beam width and greater than 0.1 arcsec. Therefore, while the primary beam of the ALMA observations is small with respect to the MUSE and HST images, the accuracy of the astrometry is the most suitable for all datasets for our scientific purposes. On the other hand, the HST broad-band images at hand (Karki et al. 2023) provide large fields of view. As a result, a number of bright objects, typically stars, are covered by each of the space telescope pointings and in every filter. Based on previous experience (Péroux et al. 2019), we expected some of these images to be slightly offset and to see a small rotation of the fields around the central pointing. Thankfully, the European Space Agency’s Gaia, with its average high positional accuracy of 0.05 milli-arcsec, provides an invaluable reference to evaluate the fidelity of the HST images. The Gaia Early Data Release 3 (EDR3), which was delivered in December 2020, has significant astrometric (positions, parallaxes, proper motions) and photometric (integrated G, GBP, GRP) improvements (Gaia Collaboration 2021). To solve for accurate and reliable astrometry, we used the positions of several stars detected both in HST images and present in the Gaia catalogue. Whenever possible, we used three bright objects to solve for potential rotation of the HST fields. The resulting offsets are sub-arcsec, with a mean value of 0.235 arcsec. After correction, we find the alignment of our targets between the HST and ALMA data to be excellent.
Finally, the one-arcmin-squared MUSE field of view also often includes multiple bright objects. The MUSE individual sub-exposures were aligned with the ESO pipeline’s exp_align recipe using these point sources resulting in an accurate relative astrometry in the combined single data cube (Péroux et al. 2022). To reach absolute astrometry, we next used the bright stars to calculate the offset with respect to the corrected HST broad-band images. The systemic offsets are in most cases smaller than the beam size (∼0.8 arcsec). In order to provide a uniform dataset for various science projects across the collaboration, we chose to edit the HST images and MUSE cubes header files to correct to the Gaia DR3 astrometry. As a result, the multi-wavelength observations of the MUSE-ALMA Haloes survey are consistently aligned to the absolute astrometry newly provided by ALMA and Gaia DR3.
4. The MUSE-ALMA Haloes ALMA observations
4.1. Primary targets from pilot programmes
Before embarking on the Large Programme, the MUSE-ALMA Haloes survey demonstrated feasibility of the observing strategy by targeting a few selected primary targets in early cycles. The results of these observations have been presented in several publications, including Péroux et al. (2019), Klitsch et al. (2018), Szakacs et al. (2021). Specifically, the quasar field Q1130−1449 was observed in Cycle 4 (PI: C. Peroux), while nine more associated galaxies were part of a Cycle 5 programme (PI: C. Peroux). Additionally, a Cycle 6 run (PI: A. Klitsch) targeted one more quasar field (Q0420−0127). These early observations informed the optimal strategy for the subsequent Large Programme.
4.2. Primary targets from ALMACAL
We further made use of ALMACAL to search for overlap with potential MUSE-ALMA Haloes primary targets. ALMACAL3 is a database of reprocessed ALMA phase and amplitude calibration scans (Bollo et al. 2024). In its latest release (ALMACAL-22), the data accumulated from the start of ALMA operations until May 2022 make up a total of over 2000 hours of integration time over a large area and at all frequencies. ALMACAL has already enabled a number of specific science findings, including measurements of the molecular-gas mass-density cosmological evolution, which is free of cosmic variance (Klitsch et al. 2019a; Hamanowicz et al. 2020; Bollo et al. 2025), as well as complete millimetre number counts (Chen et al. 2023) and other scientific results (Klitsch et al. 2019b, 2020). The cross-match search between ALMACAL and MUSE-ALMA Haloes results in one target (Q0420−0127) with sufficient observations to enable a detailed study of the system (Klitsch et al. 2018), while more valuable observations might become available in the future as part of the ever-growing ALMACAL database.
4.3. Primary targets from ALMA archives
We also cross-matched the ALMA public archives4 with MUSE-ALMA Haloes primary targets. This search led to multiple matches, as reported in Table 3 of Péroux et al. (2022). In particular, two of the MUSE-ALMA quasar fields (Q0058+0019 and Q0138−0005) have been observed with sufficient depth as part of Cycle 1 (PI: X. Prochaska) and Cycle 3 (PI: N. Kanekar). Kanekar et al. (2018) repored results from these studies that are included in the following analysis as part of the so-called previous ALMA observations.
4.4. Primary targets from ALMA large programme
In Cycle 10, we were awarded a Large Programme (PI: C. Peroux, V. Kulkarni, L. Chemin) to complement these early observations in an efficient way and provide information on the molecular content of most of the MUSE-ALMA Haloes survey primary targets. The programme targeted 39 distinct galaxies known to be associated with strong H I quasar absorbers identified with MUSE and HST. The design of the survey was made efficient by aiming at several objects per pointing, also including mosaicing of some of the fields. Bollo et al. (2026) reports the detections of these strong N(H I) quasar absorbers and their associated physical properties.
4.5. Serendipitous detections from the ALMA Large Programme
In addition to the primary targets, which correspond to MUSE-detected galaxies associated with strong N(H I)-absorbers, the ALMA Large Programme cubes contain a number of additional emission-line detections also augmented with multi-wavelength observations. While these are not directly the targets of the primary sample, some of the science described in Sect. 7 is also addressed by these serendipitous detections. These typically include CO emitters at intermediate redshifts, some of which are extremely millimetre-bright, and are the focus of further studies (Klitsch et al. 2020; Chen et al. 2023). We refer to this sample as the ‘serendipitous detections’.
5. ALMA Large Programme
5.1. Survey design
The 61.5-h ALMA Large Programme is, aimed at characterising the molecular properties of 39 z ∼ 0.5 galaxies (see Table 1) associated with absorbers with known N(H I). This efficient programme simultaneously covers several absorbers at different frequencies and/or spatially associated galaxies as well as the background quasar. The strategy of including the quasar in the field of view improves the sensitivity of the observations by enabling self-calibration, hence maximising the detection sensitivity. In addition, Fig. 6 provides examples where associated galaxies at two distinct redshifts (top row) were targeted and with multiple ALMA positions including several objects per pointing (bottom row). Table 2 summarises the number of galaxies and the number of pointings for each of the quasar absorbers.
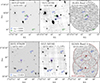 |
Fig. 6. ALMA Large Programme observing strategy. Example observations of the targeted fields Q1431−0050 and Q0152+0023. Left panel: Broad-band HST/WFPC2 imaging displaying the exquisite spatial resolution afforded by space observations. The top row illustrates cases where they are distinct quasar absorbers at different redshifts with associated galaxies highlighted in blue and green. The purple star marks the position of the background quasar labeled “QSO” in the middle panel. Middle panel: VLT/MUSE white light of the same fields showing the position of the corresponding galaxies for which a spectrum is extracted. Right panel: ALMA observations of the same fields. The bottom row illustrates that in ALMA band 4, several overlapping pointings (shown as red circles) are used to cover all the galaxies associated with the absorbers and detected in HST and VLT/MUSE. The ALMA Large Programme observing strategy is thus optimised by targeting spectrally and spatially multiple VLT/MUSE-detected galaxies. |
Seventeen quasar absorbers targeted with the ALMA Large Programme.
For the choice of ALMA bands, we devised an observing strategy based on minimising the number of setups while maximising the number of targets, and optimising atmospheric conditions (and hence the possibility to schedule them) and detection sensitivity. We targeted properly redshifted frequencies (∼150 GHz) to probe in band 4 CO(2−1), or on one occasion CO(3−2) (zabs = 1.1532 towards Q0454+039). For two targets at higher redshifts, zabs = 0.8596 and 0.8999 (towards Q0454+039 and J1211+1030, respectively), we observed CO(4−3) in band 6. Table 2 provides a summary of the bands and specific frequencies used for each quasar field, which are also plotted in the third panel of Fig. 7. The band 4 primary beam (FWHM ∼44 arcsec; ∼250 kpc at the median sample redshift) corresponds to 75% of the MUSE field of view.
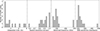 |
Fig. 7. ALMA Large Programme survey design. The histograms show the distribution of exposure time (first panel), angular resolution (second panel), frequency (third panel), and noise in the continuum (fourth panel). These values are also tabulated in Table 2. The overall survey design is rather homogeneous across quasar fields. |
All fields were set to be observable with a minimum of two distinct ALMA configurations thus maximising the possibility to schedule the programme. The run made use of the configurations C-3, C-4, and some of C-2. This was achieved by choosing a range of angular resolutions that have been proven to enable kinematical studies of such targets (Péroux et al. 2019; Szakacs et al. 2021; Barfety et al. 2026). We set the angular resolution in the range of 0.57–1.02 arcsec to optimise the forward-modelling of the velocity field and so as to enable comparison with the ionised gas probed in emission with MUSE and the neutral circumgalactic gas probed in absorption with VLT and Keck spectroscopy (Rahmani et al. 2018a). Based on early ALMA observations, the sizes of targets were known to be significantly smaller than 5 arcsec, so there were no issues with missing emission that is more extended than the chosen largest recoverable scale (LAS) of 7 arcsec. The final list of angular resolutions achieved for each of the ALMA Large Programme fields can be found in Table 2, and its distribution is plotted in the second panel of Fig. 7.
The observations were designed to reach a molecular mass of log MH2 > 9 M⊙, assuming a Milky Way spectral line energy distribution (SLED) to convert to CO(1−0) flux (Carilli & Walter 2013), a galactic conversion factor to estimate the molecular mass of αCO = 4.6 M⊙ (K km/s pc2)−1, and the z = 0.5 luminosity distance of dL = 2129 Mpc using a (0.3,0.7,0.7) cosmology. The resulting exposure times ranged from 2.4 to 7.9 hrs, with most of the targets being observed with the shortest intergration times, as illustrated in the left panel of Fig. 7. In some cases, the quasar is bright at millimetre frequencies (> 4 mJy), yet too faint to affect the dynamical range of the data. The resulting RMS continuum sensitivity does not exceed 500 μmJy/beam in all cases, as illustrated in the right panel of Fig. 7.
5.2. Observations
The MUSE-ALMA Haloes ALMA Large Programme was observed as part of Cycle 10 under ID: 2023.1.00127.L. The observations took place between late December 2023 and May 2024. The observatory was extremely efficient in performing the observations so that the time between the ALMA panel review results are known to the proposers (August 2023) and the final observations are taken (May 2024) was remarkably short.
The observations were performed with one baseband in the high-resolution frequency division mode (FDM), i.e. dual polarisation, but binned by a factor of four to achieve a spectral resolution of 15 km/s over a total bandwidth of 3600 km/s to resolve the emission lines. The remaining three basebands were used in time division mode (TDM) in order to achieve good continuum sensitivity.
A journal of observations summarising the properties of the ALMA Large Programme run is presented in Table 2. The table includes exposure times, spatial resolution, targeted frequency coverage, and sensitivity achieved for each of the observations.
5.3. Data reduction
The data reduction and imaging largely followed the ALMA observatory guidelines. Specifically, we extracted the calibrated measurement sets (ms) produced with the Common Astronomy Software Applications (CASA, version 6.5.6) by the observatory. In addition, we applied self-calibration when possible and produced the images and datacubes with different weighting schemes and channel widths.
In six of the observed fields, the background quasars wre bright enough at millimetre frequencies (≥4 mJy) to perform self-calibration. Self-calibration corrects for short-term phase and amplitude variations, resulting in a marked improvement in the sensitivity and hence dynamical range of the final images. We first cleaned the continuum image of the quasar field interactively to generate the clean model for self-calibration. During the first round of interactive cleaning, we cleaned the quasar based on the point source assumption. Then, we derived a phase-only calibration with various time intervals ranging from 30 seconds to four minutes, depending on the brightness of the quasar. We selected the time intervals based on the improvements in the final imaging products. We also applied amplitude self-calibration if the quasar was brighter than 20 mJy and accepted the signals down to 5σ when constructing the clean models. During self-calibration, the calibration tables were generated with the task GAINCAL and applied to the pipeline-calibrated measurements using APPLYCAL. After self-calibration, the RMS sensitivity improved by factors ranging from 1.1 to 7.6, compared to the ones without self-calibration. Moreover, our manual self-calibration also improved the sensitivity by a factor of about 1.2 compared to the automated observatory-based self-calibration pipeline products. In one of the fields, Q2131−1207, the quasar is bright, leaving some artefacts across the field of view. We used the CASA task UVCONTSUB to remove the continuum contamination from the bright quasar while excluding the line-emitting channels of our primary targets.
We then imaged the (self-)calibrated visibility into continuum images and 3D images (datacubes) with the CASA task TCLEAN. For four of the quasar fields, several pointings were used to maximise the spatial coverage of the targets with known sky positions. The images of the mosaic fields were created by setting the gridder to ‘mosaic’. The images were created with two different weighting schemes. The ‘natural’ weighting was used to maximize the detection sensitivity, and the ‘Briggs’ weighting (robust = 0.5) was used to achieve an optimal balance between sensitivity and spatial resolution. We chose two distinct velocity resolutions. The 15 km/s resolution corresponds to the intrinsic spectral resolution. We further applied a spectral binning of four channels to improve the signal-to-noise ratio, resulting in a spectral resolution of 60 km/s. As a result, four different types of images and datacubes were produced for each of the two weighting schemes and each two of the spectral resolution choices. The natural weighting with the 60 km/s products is better suited for searches for line emissions, while the Briggs weighting with different velocity resolutions is better suited for detailed kinematic analysis of the targets with strong line emissions.
The final RMS noise level of the cubes ranges from 180 to 500 mJy/beam and is typically < 250 mJy/beam. The resulting angular resolution varies from 0.57 to 1.02 arcsec. The ALMA primary beam in band 4 is 44 arcsec, while it is 27 arcsec in band 6. The sensitivity and angular resolution of each field are listed in Table 2.
The search for emission lines was performed on the datacubes without primary beam correction. This provides a homogeneous apparent noise level across the field of view. After we located the sources, their spectra were extracted from the primary beam-corrected datacubes generated by IMPBCOR, which properly accounts for the increased noise level near the edge of the fields. The spectra were extracted within CASA using different aperture sizes and position angles to optimize the final signal to noise (S/N) (Bollo et al. 2026). Figure 8 displays an example of such spectrum. The left panel shows the whole ALMA field, while the CO(2–1) spatial and spectral detection is reported in the middle and right panels, respectively.
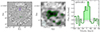 |
Fig. 8. ALMA Large Programme detection example. Left panel: Full ALMA pointing for Q0454−220 quasar field. The purple star marks the position of the background quasar labeled QSO. Middle panel: Zoomed-in view of the CO(2–1) detection corresponding to the zabs = 0.4833 absorber. The synthesised beam is indicated by the hashed area in the bottom left corner. Right panel: Corresponding ALMA spectrum displaying the flux emission at the expected frequency at 155.77 GHz. The detections of the full sample are reported in Bollo et al. (2026). |
6. Release of data products
This paper accompanies the data release of the MUSE-ALMA Haloes ALMA Large Programme datasets. Because of the legacy value of the programme, we aim to enable science beyond the primary goals of the initial survey. In particular, the sample additionally provides deep high-spatial-resolution observations of millimetre-bright background quasars (Girdhar et al. 2022, 2024; Molyneux et al. 2024). We therefore make the fully processed data available to the whole community roughly two years after the completion of the observing programme. The processed data include value-added data products generated by the team. The data products provided are listed below.
-
Raw data files.
-
One README file for each set of enhanced data uploaded (corresponding to a group or member ObsUnitSet (OUS) in ascii (.txt) format following the observatory-provided template.
-
A detailed data-description document accompanying the group (or member) OUS enhanced data package, which provides the user with a complete list of all the uploaded data products and a description of their content. The document includes the project title and project code and provides detailed descriptions of data files (and their provenance) contained in the delivery. This file provides sufficient detail for a prospective user to reproduce the data reduction and understand the multiple datasets within the products.
-
The full combined cubes including the .pbcor. FITS files according to ALMA standards and the corresponding .mask. and .pb. FITS files. The cubes are created with both natural weighting to maximise the signal-to-noise ratio and Briggs weighting with robust parameter set to 0.5. Both the spectral resolution of 15 km/s and the four-channel binned (corresponding to a spectral resolution of about 60 km/s) cubes which improved signal-to-noise are available. Cubes are supplied in FITS format.
While the raw data are available through the ALMA Science Archive5, the remaining of the products are made available through a dedicated ALMA page6. These enhanced data products are ’value-added’ and supplement the standard ALMA products generated by the ALMA observatory and already stored in the ALMA Science Archive.
In addition, the present paper summarises the primary targets’ absorption characteristics in Sect. 3 (redshift, H I column density, and neutral gas metallicity) and emission properties (impact parameter, SFR, stellar mass, and ionised gas metallicity). These values are listed in Table B.1.
7. Science goals of the ALMA large programme
The MUSE-ALMA Haloes Large Programme is aimed at characterising the molecular gas phase of galaxies with robustly determined neutral atomic and ionised circumgalactic gas and stellar components. The overreaching goal is to constrain the full baryon cycle of a sample of z ∼ 0.5 galaxies. The study tackles the following key issues:
-
The role molecular gas plays in H I-rich galaxies (Sect. 7.1).
-
How molecular gas kinematics relate to gas flows (Sect. 7.2).
-
The condensed baryon census of the circumgalactic medium (Sect. 7.3).
7.1. Quantifying the molecular gas content of H I-rich galaxies
One of the key finding of past observations with integral field spectroscopy is that strong N(H I) absorbers are associated with multiple galaxies detected with both VLT/MUSE and ALMA (Hamanowicz et al. 2020; Dutta et al. 2020; Weng et al. 2023b). This important conclusion is also supported by hydrodynamical cosmological RAMSES zoom-in and TNG simulations demonstrating that the physical properties of these objects are qualitatively similar to a small group environment that is possibly part of a cosmic filament (Péroux et al. 2019; Augustin et al. 2018; Weng et al. 2024). This challenges the historical view of strong-N(H I) quasar absorbers being associated with a single bright galaxy. Instead, several pieces of evidence suggest a situation where the H I gas probed in absorption is related to complex galaxy structures (Klitsch et al. 2018; Hamanowicz et al. 2020). In addition to MUSE detections, ALMA observations have provided new information on the molecular gas content of these systems over the last decade. Building on these successes, the MUSE-ALMA Haloes survey ALMA Large Programme characterises the molecular phase of the neutral gas of a sample of galaxies associated with strong H I-absorbers. This dataset quantifies the elements listed below:
(i) CO in H I-selected galaxies: We efficiently targeted 39 galaxies with known sky positions and measured redshifts. What makes this survey unique with respect to other projects are the accurate estimates of the SFR, metallicity, and stellar mass of all targets. Early studies (Péroux et al. 2019; Szakacs et al. 2021) demonstrated that the powerful combination of ALMA and VLT/MUSE observations is pivotal to the secure assessment of the redshift of single-line millimetre detections. The ALMA Large Programme enables a stacking analysis of emission lines to reach even lower flux limits of typically 250 μJy km/s. These results can be contrasted with the latest hydrodynamical cosmological simulations including GRIFFIN (Lahén et al. 2020; Szakacs et al. 2022), COLDSim (Maio et al. 2022; Casavecchia et al. 2024, 2025; Maio & Péroux 2026), or COLIBRE (Schaye et al. 2025; Chaikin et al. 2025; Trayford et al. 2026) to constrain which physical conditions (in terms of temperature and density) of the gas CO best traces.
(ii) Detection rate: Some studies have focused their search on metal-rich absorbers (Neeleman et al. 2016; Kanekar et al. 2018, 2020), whilst the sample targeted here has no prior on metallicity. The ALMA Large Programme allowed us to assess the frequency of CO emitters down to log MH2 > 9 M⊙ among H I-selected galaxies using an unbiased sample, selected irrespective of their metallicity. It additionally enables the assessment of the incidence of ‘CO-dark’ molecular gas, defined as regions where H2 exists without detectable CO emission due to low metallicity, reduced dust shielding, or diffuse extended gas distributions (Bollo et al. 2026). In the case of non-detections, the ALMA Large Programme is able to establish whether the ionised gas properties of CO detections and non-detections are different.
7.2. Characterising multi-phase gas flows
Galaxy-scale processes through which galaxies accrete and convert their gas into stars need to be studied in selected objects in order to obtain a complete picture of galaxy formation. Of particular importance are the interactions between gas accretion (imposed by large-scale dark-matter structures from IGM reservoirs) and feedback (launched by star-forming regions in galaxies and active supermassive black holes). It is thus key to study gas flows into and out of galaxies simultaneously as their interactions affect each other. In particular, characterising the physical processes of the inflows of gas accreting into galaxies and the outflows carrying away the energy and metals generated inside galaxies. In this context, the MUSE-ALMA Haloes survey ALMA Large Programme establishes the factors listed below:
(i) Kinematics of molecular gas: Forward modelling the 3D morpho-kinematics allows us to measure the gas’ circular velocity at the position of the background quasar sightline. Software tools for such studies include GalPak3D (Bouché et al. 2015, 2022), LINEFIT (Davies et al. 2011), and DysmalPy (Davies et al. 2004b,a; Cresci et al. 2009; Wuyts et al. 2016; Lang et al. 2017; Price et al. 2021; Lee et al. 2025). Dynamical mass estimates reveal the physics behind the build-up of intermediate redshift galaxies. The ALMA Large Programme indeed gathers new information on the orientation, geometry, and kinematics of these galaxies. These observations, in conjunction with the absorption profile along the sightline to the background quasar, enable the identification of signatures of gas flows departing from disc rotation.
(ii) Ionised and molecular gas kinematics: VLT/MUSE and ALMA observations combined offer an unprecedented view of the kinematics of the ionised and molecular gas at comparable spatial and spectral resolutions. The datasets also provide a rare opportunity to characterise the galactic cold molecular and warm ionised gas kinematics in the same galaxies; in particular, one can address the issue of whether the associated gas components have similar local velocity dispersion with implications on the physical driver of gas turbulence (feedback- and/or gravity-driven; e.g. Krumholz et al. 2018; Ginzburg et al. 2022). Specifically, by comparing the outflow velocities to SFRs, dynamical masses, and stellar masses, the ALMA Large Programme investigates if inflow and outflow velocities differ in molecular and ionised gas (Carniani et al. 2016; Herrera-Camus et al. 2025).
7.3. A census of the circumgalactic-medium-condensed baryons
Péroux & Howk (2020) referred to the condensed matter as the sum of stars, dust, and neutral and molecular gas components. The cosmic evolution of its density is well measured by current observations. Péroux & Howk (2020) found that the observed z < 2 decline of the star formation history is caused by the lack of molecular gas supply related to a drop in the net gas-accretion rate. This decline is itself driven by the decreased growth of the dark-matter haloes. These observational results are in clear agreement with the gas-regulator model (Lilly et al. 2013; Peng & Maiolino 2014), which describes a continued cycle of baryons flowing into and out of galaxies, regulating galaxy evolution. Interestingly, the neutral gas density dominates over that of the molecular gas at all redshifts on global scales (Decarli et al. 2016; Walter et al. 2020; Hamanowicz et al. 2023; Bollo et al. 2025).
These results need to be reconciled with measurements of the H I and H2 gas content of a galaxy on local scales. Indeed, galaxy haloes appear to be hiding approximately 60% of their baryons compared to expectations from the cosmological mass density (McGaugh 2008; Werk et al. 2014). With the wealth of multi-wavelength information already available in the MUSE-ALMA Haloes survey, we are in a unique position to perform a full census of the condensed baryons in these objects (O’Beirne et al. 2026). The ALMA Large Programme characterises the missing component: the molecular content of these galaxies. As such, the ALMA Large Programme allows us to probe the two factors listed below:
(i) Molecular mass: the observations enable estimates of the molecular masses from CO-emission flux measurements using updated SLED (Klitsch et al. 2022) and CO-to-H2 conversion factors (Genzel et al. 2015). Combined with known SFR estimates, these observations enable the calculation of the rate of conversion of gas into stars; that is, the so-called molecular depletion times following τdepl = MH2/SFR = 1/SFE, where SFE is the star formation efficiency, a key link to the baryon cycle. Recent studies of outer-disc rotation curves at high redshift indicate low galactic-scale dark-matter mass fractions, fDM, among massive star-forming disks, with higher fractions derived towards lower masses (Genzel et al. 2017; Übler et al. 2018; Genzel et al. 2020; Price et al. 2021; Szakacs et al. 2021; Bouché et al. 2022; Nestor Shachar et al. 2023; Puglisi et al. 2023). The ALMA Large Programme addresses this puzzle and uniquely connects the molecular kinematics to the properties of the dark-matter haloes at z ∼ 0.5 and over a wide dynamic range in galaxy mass. These observational results can be contrasted with expectations of hydrodynamical cosmological simulations such as TNG50 (Pillepich et al. 2019).
(ii) Baryonic and gas fraction: Most recent CO-emission surveys such as COLD GASS (Saintonge et al. 2017) or the 2400 objects reported by PHIBBS (Tacconi et al. 2018, 2020) informed us of the gas fractions of galaxies up to z ∼ 4. The ALMA Large Programme allows us to characterise the gas fraction of less massive galaxies by reaching objects with stellar masses of M* < 109 M⊙.
8. Conclusions
A complete understanding of the baryon cycle necessitates a thorough inventory of condensed matter comprised of stars and cold gas, within both galaxies and their circumgalactic media. Today, the neutral atomic gas H I is best probed by the emerging technique of examining the gas in absorption against background sources whose lines of sight pass through an identified foreground galaxy’s halo. Recent advancements in 3D integral field spectroscopy, which generates data cubes with a spectrum for each image pixel, have significantly improved the detection of ionised-gas emission in the circumgalactic medium of these foreground galaxies at both optical and millimetre wavelengths.
The MUSE-ALMA Haloes survey builds on these techniques to yield several key results regarding the connection between galaxies and their CGM. The survey has found a high detection rate of galaxies associated with H I absorbers, with 89% of the targeted absorbers having at least one associated galaxy within an impact parameter of 250 kpc (Péroux et al. 2017, 2019; Hamanowicz et al. 2020; Weng et al. 2023b). A significant finding is that most of these absorption systems are associated with pairs or groups of galaxies, indicating the importance of the galaxy environment in shaping the CGM (Hamanowicz et al. 2020). Interestingly, the galaxies with the smallest impact parameters to the quasar sightline are not always the closest in velocity space to the absorbing gas (Hamanowicz et al. 2020). There is an anti-correlation between the H I column density of the absorbers and the impact parameter (scaled by the virial radius) of the nearest galaxy, which is consistent with predictions from simulations (Weng et al. 2023b). The metallicity of the associated galaxies is typically higher than the metallicity of the absorbers. The absorber metallicity is also found to decrease at larger impact parameters from the host galaxy (Weng et al. 2023b). The study found marginal evidence of a bimodal distribution in the azimuthal angles of strong H I absorbers, which is similar to what has been observed for other absorption lines such as Mg II and O VI (Weng et al. 2023a). Detailed gas-kinematics studies have provided unique evidence of gas flows in the CGMs of galaxies, both in terms of wind (Rahmani et al. 2018b) and accretion (Rahmani et al. 2018a; Szakacs et al. 2021). A case-by-case analysis of the absorbers indicates that about 10% are consistent with gas accretion, while up to 30% trace outflows. The remaining absorbers are associated with gas in the galaxy disc, the intragroup medium, or low-mass galaxies that are below the detection limit of the MUSE instrument (Weng et al. 2023a).
Using HST broad-band imaging observations, Karki et al. (2023) reported that SFR shows a strong correlation with stellar mass, indicating that most absorption-selected galaxies align with the star formation main sequence of the global galaxy population. In addition, they find that more massive absorber counterparts exhibited higher central concentration and larger sizes. Finally, they report that the SFR surface densities of the absorption-selected galaxies were higher than predicted by the Kennicutt–Schmidt relation for local galaxies, which points to a higher star formation efficiency in these galaxies (Karki et al. 2023). By fitting the spectral energy distribution from HST data, the survey determined the stellar masses of the galaxies associated with the absorbers, which span a wide range from 8.1 < log(M★/M⊙) < 11.8 (Augustin et al. 2024). Most of these galaxies are found to lie on the main sequence of star-forming galaxies (Augustin et al. 2024).
Early ALMA observations enabled the study of the molecular gas in these galaxies. The first findings show that H I-selected galaxies tend to have high molecular gas masses given their low star formation rates, leading to high depletion times (Klitsch et al. 2018; Péroux et al. 2019; Szakacs et al. 2021). In this paper, we present the Cycle 10 ALMA Large Programme campaigns with optimised setups that enabled us to study objects down to log MH2 > 9 M⊙ at 5-σ, thus providing the large sample required to measure evolution and determine typical properties of these systems. This paper provides a description of the survey design, details on the observational setup and an extensive report of data-reduction processes. It also accompanies the data release of the ALMA Large Programme. Finally, the paper reviews the salient science goals that will be tackled with these extensive datasets. The project increases the number of galaxies with observational constraints of their multi-phase circumgalactic media by a factor of more than two, thus producing a representative sample of H I-rich galaxies. The overarching objective of the project is to characterise the multi-phase properties of a remarkable sample of galaxies with multi-wavelength observations using VLT/MUSE, HST UV spectroscopy and broad-band imaging to probe the physical processes by which gas is transformed into stars. By measuring the molecular mass, gas flows and gas fractions of this unique sample, the results will (1) quantify the amount of molecular gas in H I-rich galaxies, (2) characterise the role of molecular gas flows from kinematics analysis, and (3) perform a first census of the condensed baryons in the circumgalactic medium. Given the H I-selection, these data will also prepare for future observations with Square Kilometer Array (SKA), including the more of Karoo Array Telescope (KAT), dubbed MeerKAT and the Australian Square Kilometre Array Pathfinder (ASKAP).
ALMA data directly related to this publication and its figures are publicly available. Additionally, the raw data can be downloaded from the public archives with the respective project codes.
Acknowledgments
This research was supported by the International Space Science Institute (ISSI) in Bern, through ISSI International Team project #564 (The Cosmic Baryon Cycle from Space). J.C., C.B., and N.M.F.S. acknowledge funding by the European Union (ERC Advanced Grant GALPHYS, 101055023). R.A. acknowledges funding from the European Research Council (ERC) under the European Union’s Horizon 2020 research and innovation programme (grant agreement 101020943, SPECMAP-CGM). Views and opinions expressed are, however, those of the author(s) only and do not necessarily reflect those of the European Union or the European Research Council. Neither the European Union nor the granting authority can be held responsible for them. V.P.K. gratefully acknowledges support from NSF grants 2007538 and 2009811. This paper makes use of the following ALMA data: ADS/JAO.ALMA#2023.1.00127.L ALMA is a partnership of ESO (representing its member states), NSF (USA) and NINS (Japan), together with NRC (Canada), MOST and ASIAA (Taiwan), and KASI (Republic of Korea), in cooperation with the Republic of Chile. The Joint ALMA Observatory is operated by ESO, AUI/NRAO and NAOJ. In addition, publications from NA authors must include the standard NRAO acknowledgement: The National Radio Astronomy Observatory is a facility of the National Science Foundation operated under cooperative agreement by Associated Universities, Inc.
References
- Augustin, R., Péroux, C., Møller, P., et al. 2018, MNRAS, 478, 3120 [CrossRef] [Google Scholar]
- Augustin, R., Péroux, C., Karki, A., et al. 2024, MNRAS, 528, 6159 [Google Scholar]
- Banerjee, E., Muzahid, S., Schaye, J., Johnson, S. D., & Cantalupo, S. 2023, MNRAS, 524, 5148 [NASA ADS] [CrossRef] [Google Scholar]
- Banerjee, E., Muzahid, S., Schaye, J., et al. 2025, ApJ, 980, 171 [Google Scholar]
- Barfety, C., Péroux, C., Weng, S., et al. 2026, MNRAS, 524, 5524 [Google Scholar]
- Barnes, A. T., Watkins, E. J., Meidt, S. E., et al. 2023, ApJ, 944, L22 [NASA ADS] [CrossRef] [Google Scholar]
- Bollo, V., Zwaan, M., Péroux, C., et al. 2024, A&A, 690, A258 [NASA ADS] [CrossRef] [EDP Sciences] [Google Scholar]
- Bollo, V., Péroux, C., Zwaan, M., et al. 2025, A&A, 695, A163 [NASA ADS] [CrossRef] [EDP Sciences] [Google Scholar]
- Bollo, V., Péroux, C., Weng, S., et al. 2026, MNRAS, 524, 5524 [Google Scholar]
- Bouché, N., Murphy, M. T., Péroux, C., et al. 2007, ApJ, 669, L5 [CrossRef] [Google Scholar]
- Bouché, N., Murphy, M., Péroux, C., et al. 2013, Science, 341, 50 [CrossRef] [Google Scholar]
- Bouché, N., Carfantan, H., Schroetter, I., Michel-Dansac, L., & Contini, T. 2015, AJ, 150, 92 [Google Scholar]
- Bouché, N., Finley, H., Schroetter, I., et al. 2016, ApJ, 820, 121 [Google Scholar]
- Bouché, N. F., Bera, S., Krajnović, D., et al. 2022, A&A, 658, A76 [NASA ADS] [CrossRef] [EDP Sciences] [Google Scholar]
- Bouché, N. F., Wendt, M., Zabl, J., et al. 2025, A&A, 694, A67 [NASA ADS] [CrossRef] [EDP Sciences] [Google Scholar]
- Carilli, C. L., & Walter, F. 2013, ARA&A, 51, 105 [NASA ADS] [CrossRef] [Google Scholar]
- Carniani, S., Marconi, A., Maiolino, R., et al. 2016, A&A, 591, A28 [NASA ADS] [CrossRef] [EDP Sciences] [Google Scholar]
- Casavecchia, B., Maio, U., Péroux, C., & Ciardi, B. 2024, A&A, 689, A106 [NASA ADS] [CrossRef] [EDP Sciences] [Google Scholar]
- Casavecchia, B., Maio, U., Péroux, C., & Ciardi, B. 2025, A&A, 693, A119 [NASA ADS] [CrossRef] [EDP Sciences] [Google Scholar]
- Chaikin, E., Schaye, J., Schaller, M., et al. 2025, arXiv e-prints [arXiv:2509.04067] [Google Scholar]
- Chen, H.-W., Zahedy, F. S., Boettcher, E., et al. 2020, MNRAS, 497, 498 [NASA ADS] [CrossRef] [Google Scholar]
- Chen, Y., Steidel, C. C., Erb, D. K., et al. 2021, MNRAS, 508, 19 [NASA ADS] [CrossRef] [Google Scholar]
- Chen, J., Ivison, R. J., Zwaan, M. A., et al. 2023, MNRAS, 518, 1378 [Google Scholar]
- Cooke, R. J., Pettini, M., Jorgenson, R. A., Murphy, M. T., & Steidel, C. C. 2014, ApJ, 781, 31 [NASA ADS] [CrossRef] [Google Scholar]
- Cresci, G., Hicks, E. K. S., Genzel, R., et al. 2009, ApJ, 697, 115 [Google Scholar]
- Danforth, C. W., Keeney, B. A., Tilton, E. M., et al. 2016, ApJ, 817, 111 [NASA ADS] [CrossRef] [Google Scholar]
- Das, S., Mathur, S., Gupta, A., & Krongold, Y. 2021, ApJ, 918, 83 [NASA ADS] [CrossRef] [Google Scholar]
- Davies, R. I., Tacconi, L. J., & Genzel, R. 2004a, ApJ, 613, 781 [NASA ADS] [CrossRef] [Google Scholar]
- Davies, R. I., Tacconi, L. J., & Genzel, R. 2004b, ApJ, 602, 148 [NASA ADS] [CrossRef] [Google Scholar]
- Davies, R., Förster Schreiber, N. M., Cresci, G., et al. 2011, ApJ, 741, 69 [NASA ADS] [CrossRef] [Google Scholar]
- de Blok, W. J. G., Healy, J., Maccagni, F. M., et al. 2024, A&A, 688, A109 [NASA ADS] [CrossRef] [EDP Sciences] [Google Scholar]
- Decarli, R., Walter, F., Aravena, M., et al. 2016, ApJ, 833, 69 [Google Scholar]
- Dekel, A., Birnboim, Y., Engel, G., et al. 2009, Nature, 457, 451 [Google Scholar]
- Dutta, R., Fumagalli, M., Fossati, M., et al. 2020, MNRAS, 499, 5022 [CrossRef] [Google Scholar]
- Dutta, S., Muzahid, S., Schaye, J., et al. 2024, MNRAS, 528, 3745 [NASA ADS] [CrossRef] [Google Scholar]
- Dutta, S., Muzahid, S., Schaye, J., et al. 2025a, ApJ, 985, 44 [Google Scholar]
- Dutta, S., Muzahid, S., Schaye, J., et al. 2025b, MNRAS, 545, staf2080 [Google Scholar]
- Erb, D. K., Li, Z., Steidel, C. C., et al. 2023, ApJ, 953, 118 [NASA ADS] [CrossRef] [Google Scholar]
- Fynbo, J. P. U., Heintz, K. E., Neeleman, M., et al. 2018, MNRAS, 479, 2126 [NASA ADS] [CrossRef] [Google Scholar]
- Gaia Collaboration (Brown, A. G. A., et al.) 2021, A&A, 649, A1 [NASA ADS] [CrossRef] [EDP Sciences] [Google Scholar]
- Galbiati, M., Dutta, R., Fumagalli, M., Fossati, M., & Cantalupo, S. 2024, A&A, 690, A7 [NASA ADS] [CrossRef] [EDP Sciences] [Google Scholar]
- Genzel, R., Tacconi, L. J., Lutz, D., et al. 2015, ApJ, 800, 20 [Google Scholar]
- Genzel, R., Förster Schreiber, N. M., Übler, H., et al. 2017, Nature, 543, 397 [Google Scholar]
- Genzel, R., Price, S. H., Übler, H., et al. 2020, ApJ, 902, 98 [NASA ADS] [CrossRef] [Google Scholar]
- Ginzburg, O., Dekel, A., Mandelker, N., & Krumholz, M. R. 2022, MNRAS, 513, 6177 [NASA ADS] [CrossRef] [Google Scholar]
- Girdhar, A., Harrison, C. M., Mainieri, V., et al. 2022, MNRAS, 512, 1608 [NASA ADS] [CrossRef] [Google Scholar]
- Girdhar, A., Harrison, C. M., Mainieri, V., et al. 2024, MNRAS, 527, 9322 [Google Scholar]
- Green, J. C., Froning, C. S., Osterman, S., et al. 2012, ApJ, 744, 60 [NASA ADS] [CrossRef] [Google Scholar]
- Guo, Y., Bacon, R., Bouché, N. F., et al. 2023, Nature, 624, 53 [NASA ADS] [CrossRef] [Google Scholar]
- Halley, M., Kulkarni, V. P., Péroux, C., et al. 2026, MNRAS, 524, 5524 [Google Scholar]
- Hamanowicz, A., Peroux, C., Zwaan, M. A., & Rahmani, H. e. a. 2020, MNRAS, submitted [Google Scholar]
- Hamanowicz, A., Zwaan, M. A., Péroux, C., et al. 2023, MNRAS, 519, 34 [Google Scholar]
- Harms, R., & Fitch, J. 1991, SPIE Conf. Ser., 1494, 49 [NASA ADS] [Google Scholar]
- Herrera-Camus, R., González-López, J., Förster Schreiber, N., et al. 2025, A&A, 699, A80 [NASA ADS] [CrossRef] [EDP Sciences] [Google Scholar]
- Johnston, S., Taylor, R., Bailes, M., et al. 2008, Exp. Astron., 22, 151 [Google Scholar]
- Jonas, J.& MeerKAT Team 2016, in MeerKAT Science: On the Pathway to the SKA, 1 [Google Scholar]
- Kanekar, N., Prochaska, J. X., Christensen, L., et al. 2018, ApJ, 856, L23 [NASA ADS] [CrossRef] [Google Scholar]
- Kanekar, N., Prochaska, J. X., Neeleman, M., et al. 2020, ApJ, 901, L5 [CrossRef] [Google Scholar]
- Karki, A., Kulkarni, V. P., Weng, S., et al. 2023, MNRAS, 524, 5524 [Google Scholar]
- Karki, A., Kulkarni, V. P., Weng, S., et al. 2026, MNRAS, 524, 5524 [Google Scholar]
- Kimble, R. A., Woodgate, B. E., Bowers, C. W., et al. 1998, ApJ, 492, L83 [NASA ADS] [CrossRef] [Google Scholar]
- Klitsch, A., Péroux, C., Zwaan, M. A., et al. 2018, MNRAS, 475, 492 [NASA ADS] [CrossRef] [Google Scholar]
- Klitsch, A., Péroux, C., Zwaan, M. A., et al. 2019a, MNRAS, 490, 1220 [NASA ADS] [CrossRef] [Google Scholar]
- Klitsch, A., Zwaan, M. A., Péroux, C., et al. 2019b, MNRAS, 482, L65 [NASA ADS] [CrossRef] [Google Scholar]
- Klitsch, A., Zwaan, M. A., Smail, I., et al. 2020, MNRAS, 495, 2332 [CrossRef] [Google Scholar]
- Klitsch, A., Péroux, C., Zwaan, M. A., et al. 2021, MNRAS, 506, 514 [Google Scholar]
- Klitsch, A., Christensen, L., Valentino, F., et al. 2022, MNRAS, 514, 2346 [Google Scholar]
- Krumholz, M. R., Burkhart, B., Forbes, J. C., & Crocker, R. M. 2018, MNRAS, 477, 2716 [CrossRef] [Google Scholar]
- Lahén, N., Naab, T., Johansson, P. H., et al. 2020, ApJ, 891, 2 [CrossRef] [Google Scholar]
- Lang, P., Förster Schreiber, N. M., Genzel, R., et al. 2017, ApJ, 840, 92 [NASA ADS] [CrossRef] [Google Scholar]
- Lang, P., Meidt, S. E., Rosolowsky, E., et al. 2020, ApJ, 897, 122 [CrossRef] [Google Scholar]
- Lee, J. C., Sandstrom, K. M., Leroy, A. K., et al. 2023, ApJ, 944, L17 [NASA ADS] [CrossRef] [Google Scholar]
- Lee, L. L., Förster Schreiber, N. M., Price, S. H., et al. 2025, ApJ, 978, 14 [Google Scholar]
- Leroy, A. K., Schinnerer, E., Hughes, A., et al. 2021, ApJS, 257, 43 [NASA ADS] [CrossRef] [Google Scholar]
- Lilly, S. J., Carollo, C. M., Pipino, A., Renzini, A., & Peng, Y. 2013, ApJ, 772, 119 [NASA ADS] [CrossRef] [Google Scholar]
- Lofthouse, E. K., Fumagalli, M., Fossati, M., et al. 2020, MNRAS, 491, 2057 [NASA ADS] [CrossRef] [Google Scholar]
- Lofthouse, E. K., Fumagalli, M., Fossati, M., et al. 2023, MNRAS, 518, 305 [Google Scholar]
- Macquart, J.-P., Prochaska, J. X., McQuinn, M., et al. 2020, Nature, 581, 391 [Google Scholar]
- Maio, U., & Péroux, C. 2026, A&A, 657, A47 [Google Scholar]
- Maio, U., Péroux, C., & Ciardi, B. 2022, A&A, 657, A47 [NASA ADS] [CrossRef] [EDP Sciences] [Google Scholar]
- Marasco, A., de Blok, W. J. G., Maccagni, F. M., et al. 2025, A&A, 697, A86 [NASA ADS] [CrossRef] [EDP Sciences] [Google Scholar]
- Mathur, S., Gupta, A., Das, S., Krongold, Y., & Nicastro, F. 2021, ApJ, 908, 69 [NASA ADS] [CrossRef] [Google Scholar]
- McGaugh, S. S. 2008, IAU Symp., 244, 136 [Google Scholar]
- Møller, P., Christensen, L., Zwaan, M. A., et al. 2018, MNRAS, 474, 4039 [CrossRef] [Google Scholar]
- Molyneux, S. J., Calistro Rivera, G., De Breuck, C., et al. 2024, MNRAS, 527, 4420 [Google Scholar]
- Morris, S. L., Weymann, R. J., Dressler, A., et al. 1993, ApJ, 419, 524 [Google Scholar]
- Muzahid, S., Schaye, J., Marino, R. A., et al. 2020, MNRAS, 496, 1013 [Google Scholar]
- Muzahid, S., Schaye, J., Cantalupo, S., et al. 2021, MNRAS, 508, 5612 [NASA ADS] [CrossRef] [Google Scholar]
- Neeleman, M., Prochaska, J. X., Zwaan, M. A., et al. 2016, ApJ, 820, L39 [NASA ADS] [CrossRef] [Google Scholar]
- Neeleman, M., Kanekar, N., Prochaska, J. X., et al. 2018, ApJ, 856, L12 [NASA ADS] [CrossRef] [Google Scholar]
- Neeleman, M., Prochaska, J. X., Kanekar, N., & Rafelski, M. 2020, Nature, 581, 269 [Google Scholar]
- Neeleman, M., Kanekar, N., Prochaska, J. X., Rafelski, M. A., & Kahinga, L. A. 2025, ApJ, 983, 26 [Google Scholar]
- Nestor Shachar, A., Price, S. H., Förster Schreiber, N. M., et al. 2023, ApJ, 944, 78 [NASA ADS] [CrossRef] [Google Scholar]
- Nicastro, F., Kaastra, J., Krongold, Y., et al. 2018, Nature, 558, 406 [Google Scholar]
- Nielsen, N. M., Kacprzak, G. G., Pointon, S. K., et al. 2020, ApJ, 904, 164 [NASA ADS] [CrossRef] [Google Scholar]
- O’Beirne, T., Péroux, C., Weng, S., et al. 2026, MNRAS, 524, 5524 [Google Scholar]
- Peng, Y.-J., & Maiolino, R. 2014, MNRAS, 443, 3643 [NASA ADS] [CrossRef] [Google Scholar]
- Péroux, C., & Howk, J. C. 2020, ARA&A, 58, 363 [CrossRef] [Google Scholar]
- Peroux, C., & Nelson, D. 2024, arXiv e-prints [arXiv:2411.07988] [Google Scholar]
- Péroux, C., Bouché, N., Kulkarni, V. P., York, D. G., & Vladilo, G. 2011a, MNRAS, 410, 2237 [CrossRef] [Google Scholar]
- Péroux, C., Bouché, N., Kulkarni, V. P., York, D. G., & Vladilo, G. 2011b, MNRAS, 410, 2251 [Google Scholar]
- Péroux, C., Bouché, N., Kulkarni, V. P., & York, D. G. 2013, MNRAS, 436, 2650 [Google Scholar]
- Péroux, C., Rahmani, H., Quiret, S., et al. 2017, MNRAS, 464, 2053 [CrossRef] [Google Scholar]
- Péroux, C., Zwaan, M. A., Klitsch, A., et al. 2019, MNRAS, 485, 1595 [CrossRef] [Google Scholar]
- Péroux, C., Nelson, D., van de Voort, F., et al. 2020, MNRAS, 499, 2462 [CrossRef] [Google Scholar]
- Péroux, C., Weng, S., Karki, A., et al. 2022, MNRAS, 516, 5618 [Google Scholar]
- Péroux, C., Chen, J., & Bollo, V. 2026, MNRAS, 524, 5524 [Google Scholar]
- Pessa, I., Wisotzki, L., Urrutia, T., et al. 2024, A&A, 691, A5 [NASA ADS] [CrossRef] [EDP Sciences] [Google Scholar]
- Pettini, M. 2003, Cosmochemistry: The Melting Pot of Elements (New York: Cambridge Univ. Press) [Google Scholar]
- Pillepich, A., Nelson, D., Springel, V., et al. 2019, MNRAS, 490, 3196 [Google Scholar]
- Planck Collaboration XIII. 2016, A&A, 594, A13 [NASA ADS] [CrossRef] [EDP Sciences] [Google Scholar]
- Price, S. H., Shimizu, T. T., Genzel, R., et al. 2021, ApJ, 922, 143 [NASA ADS] [CrossRef] [Google Scholar]
- Puglisi, A., Dudzevičiūtė, U., Swinbank, M., et al. 2023, MNRAS, 524, 2814 [NASA ADS] [CrossRef] [Google Scholar]
- Rahmani, H., Péroux, C., Augustin, R., et al. 2018a, MNRAS, 474, 254 [NASA ADS] [CrossRef] [Google Scholar]
- Rahmani, H., Péroux, C., Schroetter, I., et al. 2018b, MNRAS, 480, 5046 [NASA ADS] [Google Scholar]
- Saintonge, A., Catinella, B., Tacconi, L. J., et al. 2017, ApJS, 233, 22 [Google Scholar]
- Schaye, J., Chaikin, E., Schaller, M., et al. 2025, arXiv e-prints [arXiv:2508.21126] [Google Scholar]
- Schinnerer, E., Hughes, A., Leroy, A., et al. 2019, ApJ, 887, 49 [NASA ADS] [CrossRef] [Google Scholar]
- Schroetter, I., Bouché, N., Péroux, C., et al. 2015, ApJ, 804, 83 [NASA ADS] [CrossRef] [Google Scholar]
- Schroetter, I., Bouché, N. F., Zabl, J., et al. 2019, MNRAS, 490, 4368 [CrossRef] [Google Scholar]
- Shull, J. M. 2014, ApJ, 784, 142 [Google Scholar]
- Shull, J. M., Smith, B. D., & Danforth, C. W. 2012, ApJ, 759, 23 [NASA ADS] [CrossRef] [Google Scholar]
- Szakacs, R., Péroux, C., Zwaan, M., et al. 2021, MNRAS, 505, 4746 [NASA ADS] [CrossRef] [Google Scholar]
- Szakacs, R., Péroux, C., Zwaan, M. A., et al. 2022, MNRAS, 512, 4736 [NASA ADS] [CrossRef] [Google Scholar]
- Tacconi, L. J., Genzel, R., Saintonge, A., et al. 2018, ApJ, 853, 179 [Google Scholar]
- Tacconi, L. J., Genzel, R., & Sternberg, A. 2020, ARA&A, 58, 157 [NASA ADS] [CrossRef] [Google Scholar]
- Trayford, J. W., Schaye, J., Correa, C., et al. 2026, MNRAS, 545, 30 [Google Scholar]
- Tripp, T. M., Lu, L., & Savage, B. D. 1998, ApJ, 508, 200 [NASA ADS] [CrossRef] [Google Scholar]
- Tumlinson, J., Peeples, M. S., & Werk, J. K. 2017, ARA&A, 55, 389 [Google Scholar]
- Übler, H., Genzel, R., Tacconi, L. J., et al. 2018, ApJ, 854, L24 [CrossRef] [Google Scholar]
- Veronese, S., de Blok, W. J. G., Healy, J., et al. 2025, A&A, 693, A97 [NASA ADS] [CrossRef] [EDP Sciences] [Google Scholar]
- Walter, F., Carilli, C., Neeleman, M., et al. 2020, ApJ, 902, 111 [Google Scholar]
- Watts, A. B., Cortese, L., Catinella, B., et al. 2024, MNRAS, 530, 1968 [NASA ADS] [CrossRef] [Google Scholar]
- Weng, S., Péroux, C., Karki, A., et al. 2023a, MNRAS, 523, 676 [NASA ADS] [CrossRef] [Google Scholar]
- Weng, S., Péroux, C., Karki, A., et al. 2023b, MNRAS, 519, 931 [Google Scholar]
- Weng, S., Péroux, C., Ramesh, R., et al. 2024, MNRAS, 527, 3494 [Google Scholar]
- Werk, J. K., Prochaska, J. X., Tumlinson, J., et al. 2014, ApJ, 792, 8 [NASA ADS] [CrossRef] [Google Scholar]
- Wuyts, S., Förster Schreiber, N. M., Wisnioski, E., et al. 2016, ApJ, 831, 149 [Google Scholar]
- Zabl, J., Bouché, N. F., Schroetter, I., et al. 2019, MNRAS, 485, 1961 [NASA ADS] [CrossRef] [Google Scholar]
Generated on 12 December 2025 with https://chat.figurelabs.ai/.
Appendix A: MUSE-ALMA haloes survey publications to date
This appendix introduces Table A.1, which lists the MUSE-ALMA Haloes survey publications to date.
MUSE-ALMA Haloes survey publications.
Appendix B: MUSE-ALMA Haloes survey associated galaxy properties
This appendix presents the table summarising the physical properties of all 79 galaxies associated with the 32 MUSE-ALMA Haloes primary targeted quasar absorbers.
MUSE-ALMA Haloes Survey associated galaxy properties.
All Tables
All Figures
|
Fig. 1. MUSE-ALMA Haloes surveys in context of other comparable efforts. This figure reports surveys targeting quasar absorbers with known N(H I) column densities as a function of redshift (this work; Muzahid et al. 2020; Chen et al. 2020; Lofthouse et al. 2023; Erb et al. 2023; Kanekar et al. 2018; Klitsch et al. 2021; Neeleman et al. 2025). IFU refers to both VLT/MUSE and Keck/KCWI. Symbol sizes are proportional to the number of targets in each survey. On top of the sizeable sample, the MUSE-ALMA Haloes survey uniquely combines 3D observations at optical and millimetre wavelengths to enable studies of the multi-phase gas. |
| In the text | |
|
Fig. 2. MUSE-ALMA Haloes number of targets covered by various observing campaigns. This figure provides a graphical viewing of the numbers listed in Table 1. The left, middle, and right panels illustrate the number of quasar fields, quasar absorbers, and galaxies associated with the quasar absorbers observed by each facility. |
| In the text | |
|
Fig. 3. Sketch of multi-phase circumgalactic and interstellar media. MUSE-ALMA Haloes uniquely probes the various component of the condensed baryonic matter as indicated in the labels: neutral molecular and atomic and ionised gas and stellar components of galaxies. This is done through various observing programmes gathering data from multi-frequency facilities as indicated by the colours. |
| In the text | |
|
Fig. 4. Properties of primary targets observed with ALMA. Left panel: Redshift distribution of 32 quasar absorbers making up the primary sample of MUSE-ALMA Haloes survey. The filled histogram (green) displays the redshift distribution of the 25 intervening absorbers targeted by ALMA observations. Middle panel: Atomic hydrogen gas column-density distribution of these strong absorbers. The selection criterion imposes the cut at log [N(H I)/cm−2] > 18. Right panel: Neutral gas absorption metallicity measured from archival and new VLT and Keck observations after ionisation and dust correction by Halley et al. (2026). The metallicity is the abundance of all metals and is expressed as [M/H]=log{N(M)/N(H)} − log{N(M)/N(H)}⊙. |
| In the text | |
|
Fig. 5. Properties of associated galaxies. Left panel: Star formation rate distribution of the 79 galaxies making up the MUSE-ALMA Haloes survey. The filled histogram displays the SFR of galaxies observed with ALMA. Middle panel: Stellar mass distribution. Right panel: Ionised gas emission metallicity. |
| In the text | |
|
Fig. 6. ALMA Large Programme observing strategy. Example observations of the targeted fields Q1431−0050 and Q0152+0023. Left panel: Broad-band HST/WFPC2 imaging displaying the exquisite spatial resolution afforded by space observations. The top row illustrates cases where they are distinct quasar absorbers at different redshifts with associated galaxies highlighted in blue and green. The purple star marks the position of the background quasar labeled “QSO” in the middle panel. Middle panel: VLT/MUSE white light of the same fields showing the position of the corresponding galaxies for which a spectrum is extracted. Right panel: ALMA observations of the same fields. The bottom row illustrates that in ALMA band 4, several overlapping pointings (shown as red circles) are used to cover all the galaxies associated with the absorbers and detected in HST and VLT/MUSE. The ALMA Large Programme observing strategy is thus optimised by targeting spectrally and spatially multiple VLT/MUSE-detected galaxies. |
| In the text | |
|
Fig. 7. ALMA Large Programme survey design. The histograms show the distribution of exposure time (first panel), angular resolution (second panel), frequency (third panel), and noise in the continuum (fourth panel). These values are also tabulated in Table 2. The overall survey design is rather homogeneous across quasar fields. |
| In the text | |
|
Fig. 8. ALMA Large Programme detection example. Left panel: Full ALMA pointing for Q0454−220 quasar field. The purple star marks the position of the background quasar labeled QSO. Middle panel: Zoomed-in view of the CO(2–1) detection corresponding to the zabs = 0.4833 absorber. The synthesised beam is indicated by the hashed area in the bottom left corner. Right panel: Corresponding ALMA spectrum displaying the flux emission at the expected frequency at 155.77 GHz. The detections of the full sample are reported in Bollo et al. (2026). |
| In the text | |
Current usage metrics show cumulative count of Article Views (full-text article views including HTML views, PDF and ePub downloads, according to the available data) and Abstracts Views on Vision4Press platform.
Data correspond to usage on the plateform after 2015. The current usage metrics is available 48-96 hours after online publication and is updated daily on week days.
Initial download of the metrics may take a while.