Open Access
Fig. 7.
Download original image
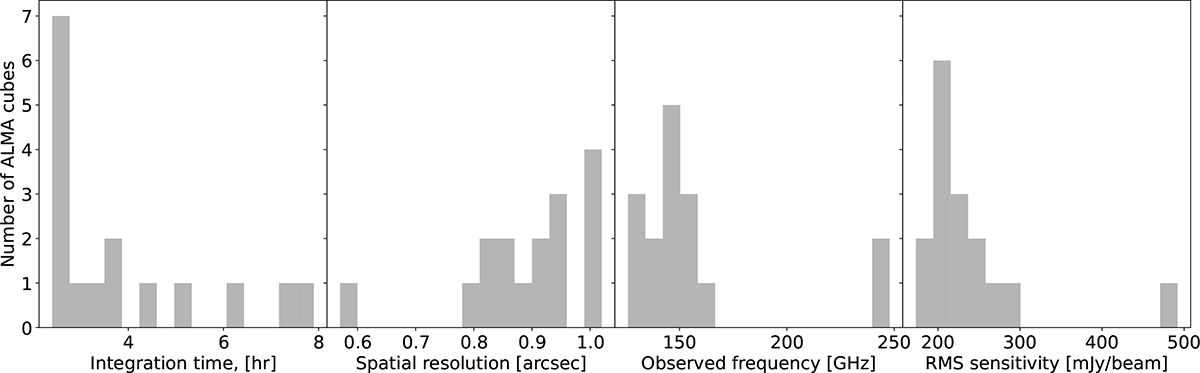
ALMA Large Programme survey design. The histograms show the distribution of exposure time (first panel), angular resolution (second panel), frequency (third panel), and noise in the continuum (fourth panel). These values are also tabulated in Table 2. The overall survey design is rather homogeneous across quasar fields.
Current usage metrics show cumulative count of Article Views (full-text article views including HTML views, PDF and ePub downloads, according to the available data) and Abstracts Views on Vision4Press platform.
Data correspond to usage on the plateform after 2015. The current usage metrics is available 48-96 hours after online publication and is updated daily on week days.
Initial download of the metrics may take a while.