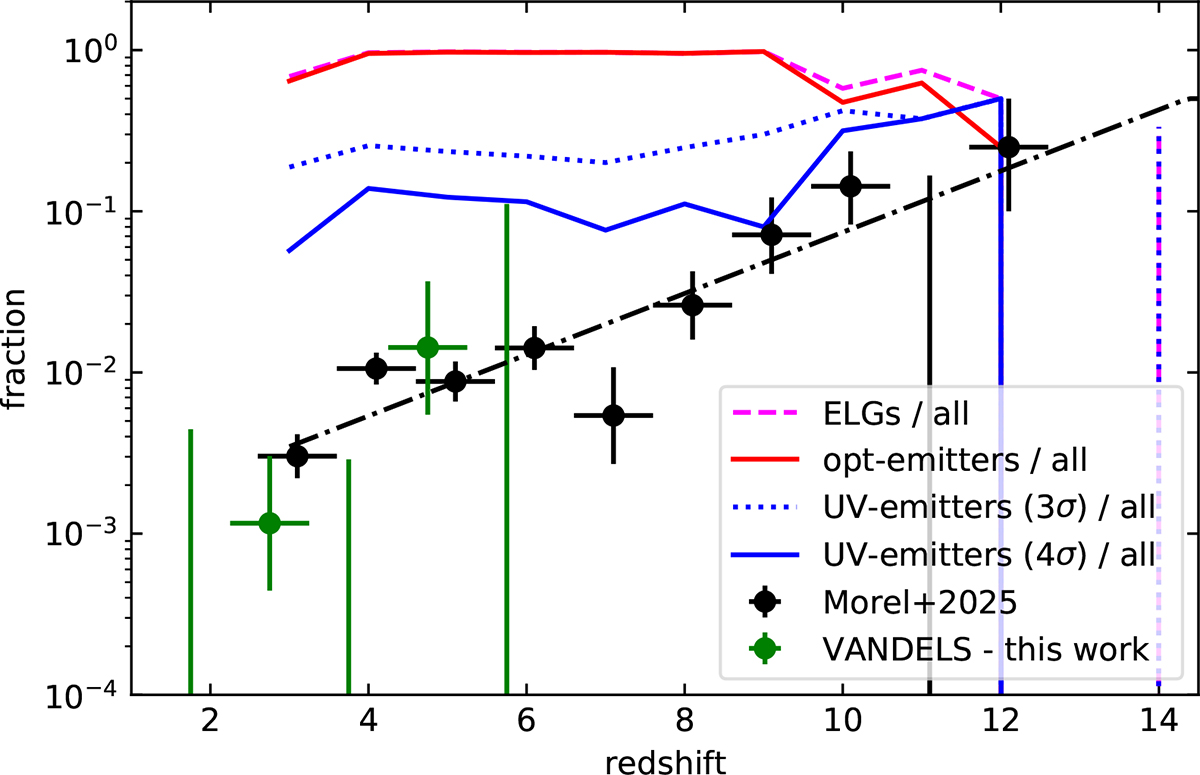
Fig. A.1.
Download original image
Redshift evolution of the fraction of N-emitters (circles) as a function of redshift, determined by Morel et al. (2025) from the JWST NIRSpec PRISM spectra (black circles and limits) and from the VANDELS survey (green circles and limits). The uncertainties show the 68% confidence range of the fractions, and the bin width along the x-axis. The blue lines show the fraction of rest-UV line emitters 4σ (solid) or 3σ detection (dotted) thresholds. The fraction of objects showing rest-optical emission lines is shown by the red line, and all emission-line galaxies (UV and/or optical) in magenta (dashed). The black dash-dotted line shows the fit to the z > 3 data, Eq. 1, obtained by Morel et al. (2025).
Current usage metrics show cumulative count of Article Views (full-text article views including HTML views, PDF and ePub downloads, according to the available data) and Abstracts Views on Vision4Press platform.
Data correspond to usage on the plateform after 2015. The current usage metrics is available 48-96 hours after online publication and is updated daily on week days.
Initial download of the metrics may take a while.