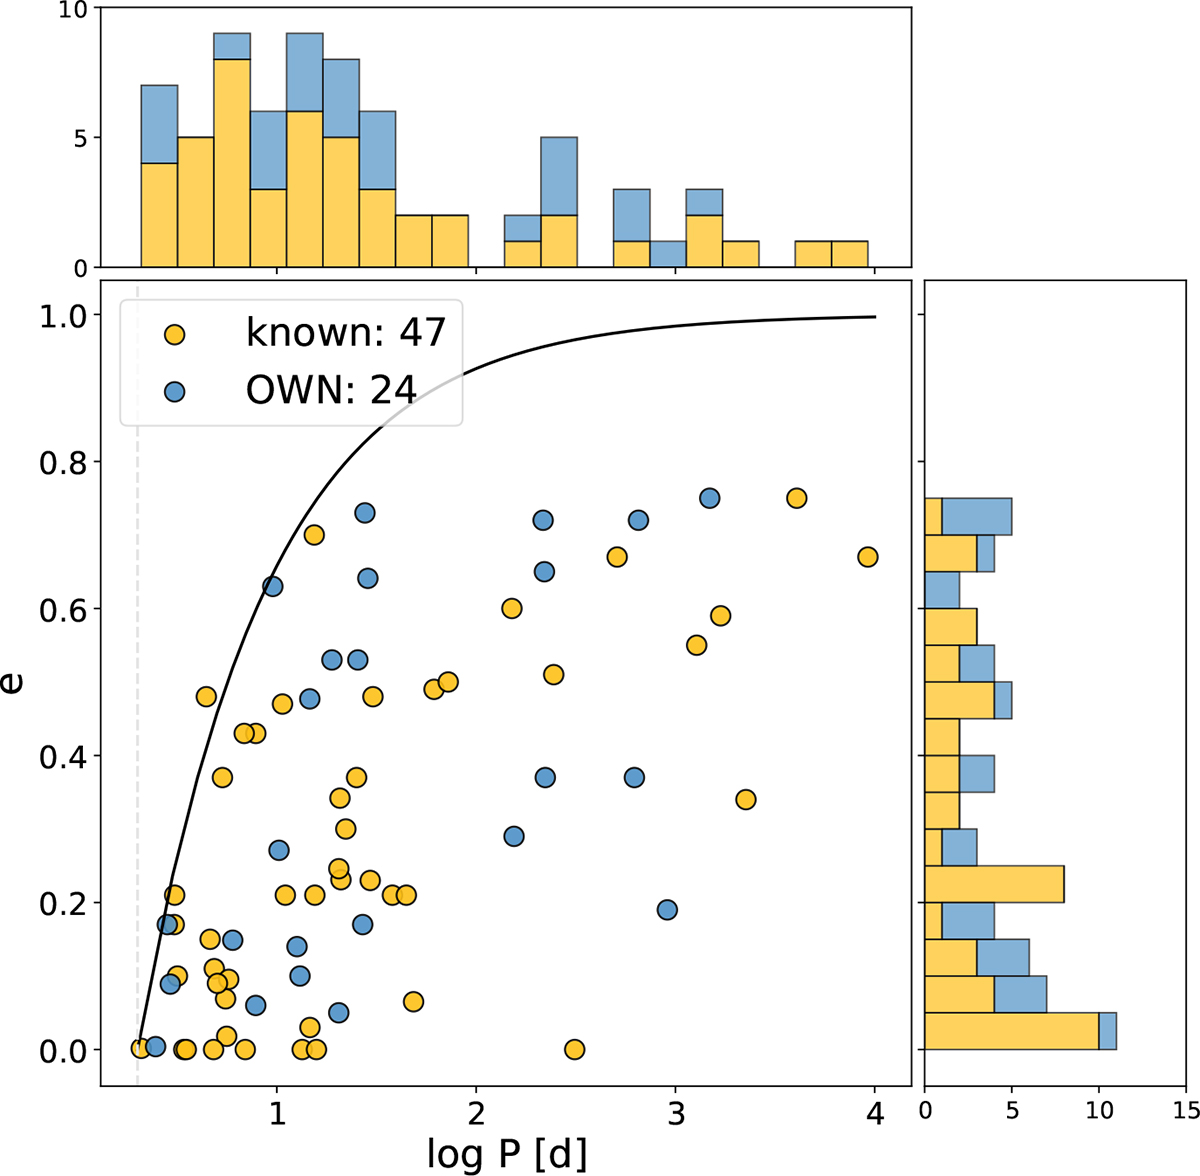
Fig. 5.
Download original image
Relationship between period and eccentricity in the OWN sample, compared to other known spectroscopic binaries from the literature. Histograms are also shown. It is noticeable how the OWN SB1 populate the longer periods (log P > 2) and also the largest eccentricities. The continuous curve depicts the upper limit for eccentricity (Moe & Di Stefano 2017).
Current usage metrics show cumulative count of Article Views (full-text article views including HTML views, PDF and ePub downloads, according to the available data) and Abstracts Views on Vision4Press platform.
Data correspond to usage on the plateform after 2015. The current usage metrics is available 48-96 hours after online publication and is updated daily on week days.
Initial download of the metrics may take a while.