Fig. 1.
Download original image
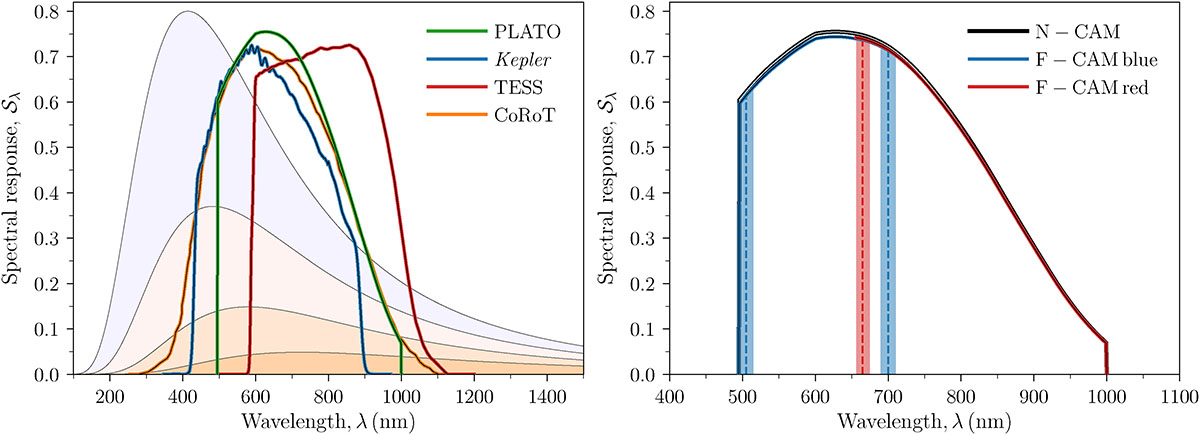
Left: Spectral response functions, 𝒮λ, for the PLATO (Sect. 2), Kepler (Van Cleve & Caldwell 2016), TESS (Ricker et al. 2014) (normalised to a maximum of Kepler), and CoRoT (Auvergne et al. 2009) missions as a function of wavelength λ. The shaded regions show blackbody spectra with temperatures of 7000, 6000, 5000, and 4000 K (normalised to a maximum of 0.8 for the hottest, or bluest, curve). Right: Spectral response functions for the PLATO N- and F-CAMs. The vertical dashed lines show the nominal passband limits of the blue and red F-CAMs, with the shaded ±10 nm regions indicating the potential variation in these from the incident angle.
Current usage metrics show cumulative count of Article Views (full-text article views including HTML views, PDF and ePub downloads, according to the available data) and Abstracts Views on Vision4Press platform.
Data correspond to usage on the plateform after 2015. The current usage metrics is available 48-96 hours after online publication and is updated daily on week days.
Initial download of the metrics may take a while.