| Issue |
A&A
Volume 708, April 2026
|
|
|---|---|---|
| Article Number | A150 | |
| Number of page(s) | 5 | |
| Section | Astrophysical processes | |
| DOI | https://doi.org/10.1051/0004-6361/202558666 | |
| Published online | 03 April 2026 | |
Bolometric corrections of stellar oscillation mode amplitudes as observed by the PLATO mission
I. Planck-spectrum estimates
1
Stellar Astrophysics Centre, Department of Physics and Astronomy, Aarhus University, Ny Munkegade 120, DK-8000 Aarhus C, Denmark
2
Institut de Recherche en Astrophysique et Planétologie (IRAP), Université de Toulouse, CNRS, CNES, 14 avenue Edouard Belin, 31400 Toulouse, France
3
School of Physics and Astronomy, University of Birmingham, Edgbaston, Birmingham B15 2TT, UK
★ Corresponding author: This email address is being protected from spambots. You need JavaScript enabled to view it.
Received:
18
December
2025
Accepted:
9
March
2026
Abstract
Aims. We derive bolometric correction functions for oscillation mode amplitudes observed by the different cameras of the ESA PLATO mission. Such corrections between bolometric (full light) and mission instrument-specific amplitudes enable comparisons to theoretical expectations and amplitude conversion between different photometric missions, which is essential for proper detectability yields and target selection.
Methods. Bolometric correction functions were calculated assuming a Planck function approximation for the stellar spectral flux distribution. The calculations follow the procedures applied in earlier analyses for the NASA Kepler and TESS missions. We derived power-law and polynomial parametrisations of the bolometric corrections with Teff.
Results. We find that on average, oscillation mode amplitudes from PLATO’s normal cameras (N-CAMs) are expected to be ∼6.7% lower compared to Kepler, and ∼12.5% higher compared to TESS. A significant average amplitude ratio of ∼25% is expected for amplitudes measured using the blue PLATO fast camera (F-CAM) compared to TESS. We find that observations of bright solar-like oscillators, especially with PLATO’s F-CAMs, would provide an important test of the predicted corrections.
Key words: asteroseismology / instrumentation: photometers / methods: data analysis / techniques: photometric / stars: oscillations / stars: solar-type
© The Authors 2026
 Open Access article, published by EDP Sciences, under the terms of the Creative Commons Attribution License (https://creativecommons.org/licenses/by/4.0), which permits unrestricted use, distribution, and reproduction in any medium, provided the original work is properly cited.
This article is published in open access under the Subscribe to Open model. This email address is being protected from spambots. You need JavaScript enabled to view it. to support open access publication.
1. Introduction
The ability to predict the amplitudes of solar-like oscillation modes for a space-based photometric mission, based on theoretical or empirical expectations, is essential to enable informed target selection and for realistically estimating asteroseismic detectability yields (Chaplin et al. 2011; Schofield et al. 2019; Goupil et al. 2024). Furthermore, the ability to convert observed mode or granulation amplitudes obtained from a given mission (e.g. Huber et al. 2011; Corsaro et al. 2013; Sayeed et al. 2025) to their bolometric counterparts is required to, for example, appraise the quality of theoretical models for mode excitation (Houdek et al. 1999; Zhou et al. 2019, 2021).
We provide an estimate of the bolometric correction cBP − bol for the ESA PLATO mission (Rauer et al. 2025), scheduled for launch in late 2026. Sect. 2 describes the PLATO spectral response functions used in the calculations of cBP − bol, while Sect. 3 provides the results for PLATO’s ‘Normal’ (N-CAM) and ‘Fast’ (F-CAM) camera cBP − bol values based on Planck spectra, including comparisons to the CoRoT, Kepler, and TESS photometric missions (Michel et al. 2009; Ballot et al. 2011; Lund 2019). In Sect. 4 we discuss the impact and use of the cBP − bol values.
2. PLATO spectral response functions
An essential ingredient for computing the mode amplitude bolometric correction factor is the spectral response function (𝒮λ) of the instrument–providing, as a function of wavelength, the fraction of incident light that contributes to a measured photometric signal. While the absolute values of this throughput are important for the photometric noise level and flux-to-magnitude conversion (Marchiori et al. 2019; Börner et al. 2024; Jannsen et al. 2024), here we are only sensitive to the relative values of 𝒮λ with wavelength. For the following description, we refer, in particular, to the ‘PLATO Instrument Performance Report’ (PIPR; Neimi 2025).
For the N- and F-CAMs, we adopted for 𝒮λ the so-called ‘current best estimate’ (CBE; see PIPR table 3–1) of the beginning-of-life (BoL) mean combined photon conversion efficiency (PCE), as shown in Fig. 1. For the N-CAMs, the PCE used here is the product of the ‘as designed’ CBE for on-axis optical transmission (OT; including worst-case levels of molecular and particulate contamination) and the mean flight model ‘as measured1’ charge-coupled device (CCD) quantum efficiency (QE); see Fig. 2. The N-CAM passband covers the spectral range from 500–1000 nm.
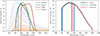 |
Fig. 1. Left: Spectral response functions, 𝒮λ, for the PLATO (Sect. 2), Kepler (Van Cleve & Caldwell 2016), TESS (Ricker et al. 2014) (normalised to a maximum of Kepler), and CoRoT (Auvergne et al. 2009) missions as a function of wavelength λ. The shaded regions show blackbody spectra with temperatures of 7000, 6000, 5000, and 4000 K (normalised to a maximum of 0.8 for the hottest, or bluest, curve). Right: Spectral response functions for the PLATO N- and F-CAMs. The vertical dashed lines show the nominal passband limits of the blue and red F-CAMs, with the shaded ±10 nm regions indicating the potential variation in these from the incident angle. |
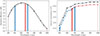 |
Fig. 2. Left: QE as a function of wavelength used for computing 𝒮λ (given by the product of QE and the OT in the right panel). The markers indicate the available averages from tests of N-CAM flight model CCDs, while the shaded region indicates the associated standard deviation. The full or dashed black line shows the adopted interpolation, where the dashed part indicates the wavelength range outside the PLATO passbands. The vertical dashed lines show the nominal passband limits of the blue and red F-CAMs, with the shaded ±10 nm regions indicating the potential variation in these from the incident angle, with the upper red filter limit fixed at 1000 nm by the detector response. Right: OT for the N-CAM (black) and F-CAMs (blue and red) as a function of wavelength. The markers indicate available measurement points. The F-CAM passband boundaries are marked as in the left panel. The full lines show a simple linear interpolation of the measurement points. |
For the F-CAMs, the OT is assumed to be the same as for the N-CAMs, as the optical design is identical; however, the PCE includes the additional impact of the red/blue spectral bandpass filters on the F-CAM window surfaces. These filters have a very high transmission2 (≥98%) and hence mainly define the passband for the F-CAMS. The manufacturer limits specify boundaries of 505 ± 10 nm and 700 ± 10 nm for the blue filter, and a lower boundary of 665 ± 10 nm for the red filter, while the detector response defines an upper boundary at 1000 nm. In this work, we assumed, as a baseline, the nominal values from these ranges. The QE is expected to remain unchanged during the mission, while the OT is expected to degrade slightly from the impact of radiation on glass transmission and coating efficiency, increasing charge transfer inefficiency (Mishra et al. 2026). Nevertheless, this effect is not expected to be wavelength-dependent.
The uncertainty considered for 𝒮λ comes from the uncertainty or dynamical range in the QE from tests of N-CAM full-frame CCD flight models. It lies at an ∼3% level at 500 nm, and smaller for longer wavelengths. There is a small difference in the QE from the different CCDs used for the N-CAMs (full-frame CCD) and F-CAMs (frame-transfer CCD), but this is well within the included uncertainty.
In terms of potential systematic variations in 𝒮λ, the QE is known to be affected by temperature variations in a wavelength-dependent manner3. However, this is only at an ∼1% level for a 10K temperature range at 900 nm, with nearly no variation below 700 nm. Finally, we note potential impact from the incident angle: the QE increases by up to ∼3 − 5% in the wings of the spectral band, while decreasing by up to ∼1 − 2% at ∼800 nm for incident angles between 25–35° (Verhoeve et al. 2016). Furthermore, the incident angle will affect the in-band to out-of-band transition wavelength of the F-CAM filters, shifting these to lower wavelengths at a level of 2 − 4 nm at 10° and 9 − 15 nm at 20° (PIPR).
To construct the 𝒮λ (i.e. the product between QE and OT), we first interpolated the QE values using a second-order univariate spline, while the OT values for the N- and F-CAMs were linearly interpolated (more flexible interpolations generally led to unwanted variations near the F-CAM boundaries around the filter’s overlap region). We note that, currently, no OT measurements exist at the 700 nm boundary of the blue F-CAM; hence, beyond 665 nm the 𝒮λ for the blue F-CAM is given by linear extrapolation.
While the fine details of the 𝒮λ specifications might change before the launch of PLATO, the response adopted here should still provide a good baseline for understanding the bolometric correction. In what follows, we assess the impact of several potential small variations in 𝒮λ.
3. PLATO bolometric corrections
The bolometric correction cBP − bol provides the conversion factor from oscillation mode (or granulation) amplitudes measured in the bandpass (BP) of a given photometric mission to bolometric amplitudes, i.e.
 (1)
(1)
and thereby different mission instrument-specific cBP − bol-values provide the conversion of amplitudes between missions:
 (2)
(2)
In the current analysis, we consider only a blackbody (Planck) function to describe the stellar spectral flux density and refer to Lund (2019) and Ballot et al. (2011) for details on the procedure for calculating cBP − bol. We consider the photometric missions of PLATO, TESS, Kepler, and CoRoT. When using simply ‘PLATO’, we refer to the values from the N-CAMs. Either ‘FCB’ or ‘FCR’ is added when referring to the blue or red PLATO F-CAMs.
In Fig. 3, we show the calculated values of cBP − bol for the different missions as a function of effective temperature and provide in Appendix A (Table A.1) the new power-law and polynomial relations for the PLATO mission, following the setup in Lund (2019). As expected from the PLATO N-CAM passband (Fig. 1), the cPLATO − bol values lie between those of Kepler and TESS, while these missions nearly overlap with, respectively, the blue and red F-CAM values.
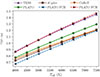 |
Fig. 3. Values for the bolometric correction cBP − bol (Eq. 1) based on Planck spectra, as a function of Teff. Different lines and markers refer to different photometric missions or filters for the PLATO mission (see legend). |
In Fig. 4, we display several combinations of amplitude ratios (Eq. 2) between the missions and instruments. Across the Teff range considered, we find that on average oscillation mode amplitudes from PLATO (N-CAMs) can be expected to be ∼6.7% lower than Kepler, and ∼12.5% higher than TESS. A significant amplitude difference is found between TESS and the blue PLATO F-CAM, with amplitudes being on average ∼25% higher for PLATO, peaking around ∼29% higher at the lowest Teff values. As expected from the overlap in cBP − bol between TESS and the red PLATO F-CAM (Fig. 3), a similar amplitude ratio is expected between the blue and red F-CAMs.
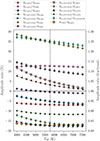 |
Fig. 4. Amplitude ratios between different missions, and/or the different filters of the PLATO mission, as a function of Teff (see legend). The amplitude change is shown as both a percentage deviation (left axis) and as a fractional ratio (right axis). The horizontal dashed line indicates equal amplitudes, while the vertical dotted lines indicate the solar Teff. |
Considering the uncertainty in the spectral response via the QE (Sect. 2), we also estimated the impact on the cPLATO − bol values of varying the QE linearly within a ±3σ band, starting from QE ± 3σ at 500 nm and ending at QE ∓ 3σ at 1000 nm. This resulted in only a ≈ ± 0.15 − 0.20% fractional change compared to the nominal value, with the version starting low at 500 nm (i.e. the most redshifted) having the highest cBP − bol, corresponding to the lowest amplitudes. Similarly, we tested the expected change to the spectral response via the QE’s sensitivity to the incident angle. This was done by changing the QE linearly from a +5% increase at 500 nm to a −2% decrease at 800 nm and then rising to a +5% increase at 1000 nm. This modification to the QE amounted to a mere −0.22% average change to cPLATO − bol. Overall, we consider these effects to have a negligible impact on cPLATO − bol.
A more significant change comes from considering the incident angle impact on the bolometric corrections for the PLATO F-CAMs. Here, in addition to the above modification to the QE, the boundaries of the F-CAM passbands are shifted blueward (Sect. 2). We assume a shift of the blue filter boundaries by −10 nm (i.e. spanning the range 495 − 690 nm) and similarly for the lower boundary of the red filter (now spanning 655 − 1000 nm), corresponding to incident angles between 25–35° (Verhoeve et al. 2016). As expected, the blueward shift or extension of the passbands decreases the cBP − bol values for both filters, as they move closer to the peak of the Planck functions for the stars considered. The change is greater for the blue filter as both its boundaries shift, with an overall decrease in cBP − bol by approximately −1.5%. The red filter only extends slightly into the blue, resulting in a −0.75% decrease in cBP − bol. Following Eq. (2) these decreases in cBP − bol result in corresponding increases in the amplitudes from the F-CAMs compared to other missions. The amplitude ratio between the blue and red F-CAM filters (APLATO FCB/APLATO FCR) generally increases by +1% across the Teff range covered in Fig. 4. While several different combinations of perturbations could be imagined, the modifications considered above suggest that modest variations in the spectral response functions (N/F-CAMs) will generally not exceed the ±1 − 2% level.
4. Discussion
We provided relations for the bolometric conversion factors for the upcoming ESA PLATO mission, for both the normal (N) and the red/blue fast (F) cameras. This makes it possible to convert empirical amplitude relations from, for instance, the Kepler mission to PLATO, which has a direct impact on the prediction of asteroseismic detectability yields. This should be considered in future updates of, say, the yields of Goupil et al. (2024), where amplitude (and mode visibility) relations from Kepler were adopted – which we can expect to be ∼6.7% higher than what PLATO’s N-CAMs will observe. We also note that simulation tools, such as PlatoSim (Jannsen et al. 2024, 2025), should include the provided bolometric corrections in their scaling of oscillation mode amplitudes, rather than, for example, the conversion by BP-integrated flux ratios currently included in PlatoSim.
With its F-CAMs, PLATO will provide an intriguing opportunity to directly test the cBP − bol predictions (Sreenivas et al. 2025), at least in a relative sense. Mode amplitudes from the blue and red F-CAMs are expected to differ by up to ∼25% (Fig. 4), so having simultaneous photometry from both F-CAMs for a given bright target would enable a direct test of the predictions. From TESS, we already know of several bright dwarf and subgiant solar-like oscillating stars positioned in the PLATO fields (Lund et al. 2025, Panetier et al., in prep.; see also Eschen et al. 2024 and Nascimbeni et al. 2025), which could be good candidates for F-CAM observations. If the oscillations are detectable with TESS, they will certainly be detectable in both the PLATO N- and F-CAMs, yielding additional comparisons for the predictions.
In the current analysis, we approximated the stellar spectral flux densities by Planck spectra. In a follow-up analysis, we will, as in Lund (2019), appraise the impact of using synthetic spectra; include any potential updates to the PLATO response functions; and provide estimates for oscillation mode visibilities (Ballot et al. 2011).
Acknowledgments
We are grateful to Juan Cabrera, Sami Naimi, Demetrio Magrin, Francesco Borsa, Nicholas Jannsen and other members of the PLATO Performance Team for their assistance and discussions on the inputs to the PLATO spectral response functions used in this work. This work presents results from the European Space Agency (ESA) space mission PLATO. The PLATO payload, the PLATO Ground Segment and PLATO data processing are joint developments of ESA and the PLATO Mission Consortium (PMC). Funding for the PMC is provided at national levels, in particular by countries participating in the PLATO Multilateral Agreement (Austria, Belgium, Czech Republic, Denmark, France, Germany, Italy, Netherlands, Portugal, Spain, Sweden, Switzerland, Norway, and United Kingdom) and institutions from Brazil. Members of the PLATO Consortium can be found at https://platomission.com/. The ESA PLATO mission website is https://www.cosmos.esa.int/plato. We thank the teams working for PLATO for all their work. MNL acknowledges support from the ESA PRODEX programme (PEA 4000142995). JB acknowledges the support from CNES, focused on PLATO.
References
- Auvergne, M., Bodin, P., Boisnard, L., et al. 2009, A&A, 506, 411 [NASA ADS] [CrossRef] [EDP Sciences] [Google Scholar]
- Ballot, J., Barban, C., & van’t Veer-Menneret, C. 2011, A&A, 531, A124 [NASA ADS] [CrossRef] [EDP Sciences] [Google Scholar]
- Börner, A., Paproth, C., Cabrera, J., et al. 2024, Exp. Astron., 58, 1 [CrossRef] [Google Scholar]
- Chaplin, W. J., Kjeldsen, H., Bedding, T. R., et al. 2011, ApJ, 732, 54 [CrossRef] [Google Scholar]
- Corsaro, E., Fröhlich, H.-E., Bonanno, A., et al. 2013, MNRAS, 430, 2313 [Google Scholar]
- Eschen, Y. N. E., Bayliss, D., Wilson, T. G., et al. 2024, MNRAS, 535, 1778 [NASA ADS] [CrossRef] [Google Scholar]
- Goupil, M. J., Catala, C., Samadi, R., et al. 2024, A&A, 683, A78 [NASA ADS] [CrossRef] [EDP Sciences] [Google Scholar]
- Houdek, G., Balmforth, N. J., Christensen-Dalsgaard, J., & Gough, D. O. 1999, A&A, 351, 582 [NASA ADS] [Google Scholar]
- Huber, D., Bedding, T. R., Stello, D., et al. 2011, ApJ, 743, 143 [Google Scholar]
- Jannsen, N., De Ridder, J., Seynaeve, D., et al. 2024, A&A, 681, A18 [NASA ADS] [CrossRef] [EDP Sciences] [Google Scholar]
- Jannsen, N., Tkachenko, A., Royer, P., et al. 2025, A&A, 694, A185 [NASA ADS] [CrossRef] [EDP Sciences] [Google Scholar]
- Lund, M. N. 2019, MNRAS, 489, 1072 [Google Scholar]
- Lund, M. N., Chontos, A., Grundahl, F., et al. 2025, A&A, 701, A285 [NASA ADS] [CrossRef] [EDP Sciences] [Google Scholar]
- Marchiori, V., Samadi, R., Fialho, F., et al. 2019, A&A, 627, A71 [NASA ADS] [CrossRef] [EDP Sciences] [Google Scholar]
- Michel, E., Samadi, R., Baudin, F., et al. 2009, A&A, 495, 979 [NASA ADS] [CrossRef] [EDP Sciences] [Google Scholar]
- Mishra, S., Samadi, R., & Bérard, D. 2026, A&A, 707, A200 [NASA ADS] [CrossRef] [EDP Sciences] [Google Scholar]
- Nascimbeni, V., Piotto, G., Cabrera, J., et al. 2025, A&A, 694, A313 [NASA ADS] [CrossRef] [EDP Sciences] [Google Scholar]
- Neimi, S. 2025, PLATO Instrument Performance Report, Report Issue 3, revision 0, PLATO Project, PTO-EST-PL-REP-0952 [Google Scholar]
- Rauer, H., Aerts, C., Cabrera, J., et al. 2025, Exp. Astron., 59, 26 [Google Scholar]
- Ricker, G. R., Winn, J. N., Vanderspek, R., et al. 2014, SPIE Conf. Ser., 9143, 20 [Google Scholar]
- Sayeed, M., Huber, D., Chontos, A., & Li, Y. 2025, AJ, 170, 212 [Google Scholar]
- Schofield, M., Chaplin, W. J., Huber, D., et al. 2019, ApJS, 241, 12 [Google Scholar]
- Sreenivas, K. R., Bedding, T. R., Huber, D., et al. 2025, MNRAS, 537, 3265 [Google Scholar]
- Van Cleve, J. E., & Caldwell, D. A. 2016, Kepler Instrument Handbook (KSCI-19033-002), Tech. rep. [Google Scholar]
- Verhoeve, P., Prod’homme, T., Oosterbroek, T., et al. 2016, SPIE Conf. Ser., 9915, 99150Z [NASA ADS] [Google Scholar]
- Zhou, Y., Asplund, M., & Collet, R. 2019, ApJ, 880, 13 [NASA ADS] [CrossRef] [Google Scholar]
- Zhou, Y., Nordlander, T., Casagrande, L., et al. 2021, MNRAS, 503, 13 [NASA ADS] [CrossRef] [Google Scholar]
‘Payload Straylight Analysis Report’ (PTO-EST-PL-REP-0936) table 4, from ‘PLATO FM Deliverable Device EO Results’ (PTO-E2V-CCD-DP-1114, issue 5.0).
Set to a constant value of 0.986 between 500 and 700 nm (blue) and 0.989 between 665 and 1100 nm (red).
See ‘Instrument Signal and Noise Budget’ (PLATO-DLR-PL-RP-0001, issue 4.0).
Appendix A: Bolometric correction relations
Table A.1 provides the coefficients for the two parametrisations considered for the dependence of cBP − bol on Teff. The subscript of the models refers to a functional form of either:
 (A.1)
(A.1)
Parameters of the bolometric correction relations.
for a subscript of ‘1’, or a second-order polynomial:
 (A.2)
(A.2)
for a subscript of ‘2’. In addition to the subscript number, the adopted spectral response is also indicated (N-CAM, F-CAM blue (FCB), or F-CAM red (FCR)). As seen from the residual root-mean-square errors in Table A.1, the polynomial function provides the closest match to the theoretical values (as expected from its additional parameters), and should therefore in general be adopted to approximate cP−bol(Teff).
All Tables
All Figures
|
Fig. 1. Left: Spectral response functions, 𝒮λ, for the PLATO (Sect. 2), Kepler (Van Cleve & Caldwell 2016), TESS (Ricker et al. 2014) (normalised to a maximum of Kepler), and CoRoT (Auvergne et al. 2009) missions as a function of wavelength λ. The shaded regions show blackbody spectra with temperatures of 7000, 6000, 5000, and 4000 K (normalised to a maximum of 0.8 for the hottest, or bluest, curve). Right: Spectral response functions for the PLATO N- and F-CAMs. The vertical dashed lines show the nominal passband limits of the blue and red F-CAMs, with the shaded ±10 nm regions indicating the potential variation in these from the incident angle. |
| In the text | |
|
Fig. 2. Left: QE as a function of wavelength used for computing 𝒮λ (given by the product of QE and the OT in the right panel). The markers indicate the available averages from tests of N-CAM flight model CCDs, while the shaded region indicates the associated standard deviation. The full or dashed black line shows the adopted interpolation, where the dashed part indicates the wavelength range outside the PLATO passbands. The vertical dashed lines show the nominal passband limits of the blue and red F-CAMs, with the shaded ±10 nm regions indicating the potential variation in these from the incident angle, with the upper red filter limit fixed at 1000 nm by the detector response. Right: OT for the N-CAM (black) and F-CAMs (blue and red) as a function of wavelength. The markers indicate available measurement points. The F-CAM passband boundaries are marked as in the left panel. The full lines show a simple linear interpolation of the measurement points. |
| In the text | |
|
Fig. 3. Values for the bolometric correction cBP − bol (Eq. 1) based on Planck spectra, as a function of Teff. Different lines and markers refer to different photometric missions or filters for the PLATO mission (see legend). |
| In the text | |
|
Fig. 4. Amplitude ratios between different missions, and/or the different filters of the PLATO mission, as a function of Teff (see legend). The amplitude change is shown as both a percentage deviation (left axis) and as a fractional ratio (right axis). The horizontal dashed line indicates equal amplitudes, while the vertical dotted lines indicate the solar Teff. |
| In the text | |
Current usage metrics show cumulative count of Article Views (full-text article views including HTML views, PDF and ePub downloads, according to the available data) and Abstracts Views on Vision4Press platform.
Data correspond to usage on the plateform after 2015. The current usage metrics is available 48-96 hours after online publication and is updated daily on week days.
Initial download of the metrics may take a while.