Fig. 2.
Download original image
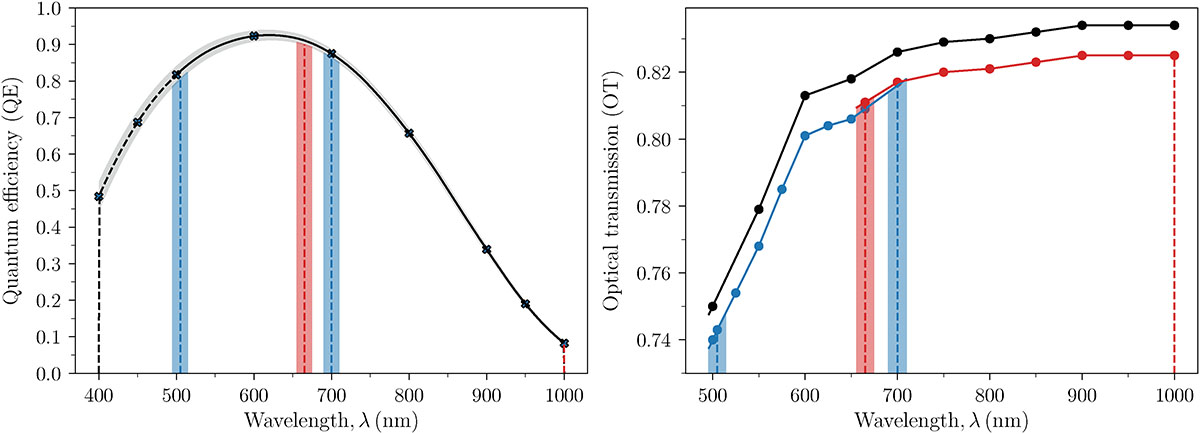
Left: QE as a function of wavelength used for computing 𝒮λ (given by the product of QE and the OT in the right panel). The markers indicate the available averages from tests of N-CAM flight model CCDs, while the shaded region indicates the associated standard deviation. The full or dashed black line shows the adopted interpolation, where the dashed part indicates the wavelength range outside the PLATO passbands. The vertical dashed lines show the nominal passband limits of the blue and red F-CAMs, with the shaded ±10 nm regions indicating the potential variation in these from the incident angle, with the upper red filter limit fixed at 1000 nm by the detector response. Right: OT for the N-CAM (black) and F-CAMs (blue and red) as a function of wavelength. The markers indicate available measurement points. The F-CAM passband boundaries are marked as in the left panel. The full lines show a simple linear interpolation of the measurement points.
Current usage metrics show cumulative count of Article Views (full-text article views including HTML views, PDF and ePub downloads, according to the available data) and Abstracts Views on Vision4Press platform.
Data correspond to usage on the plateform after 2015. The current usage metrics is available 48-96 hours after online publication and is updated daily on week days.
Initial download of the metrics may take a while.