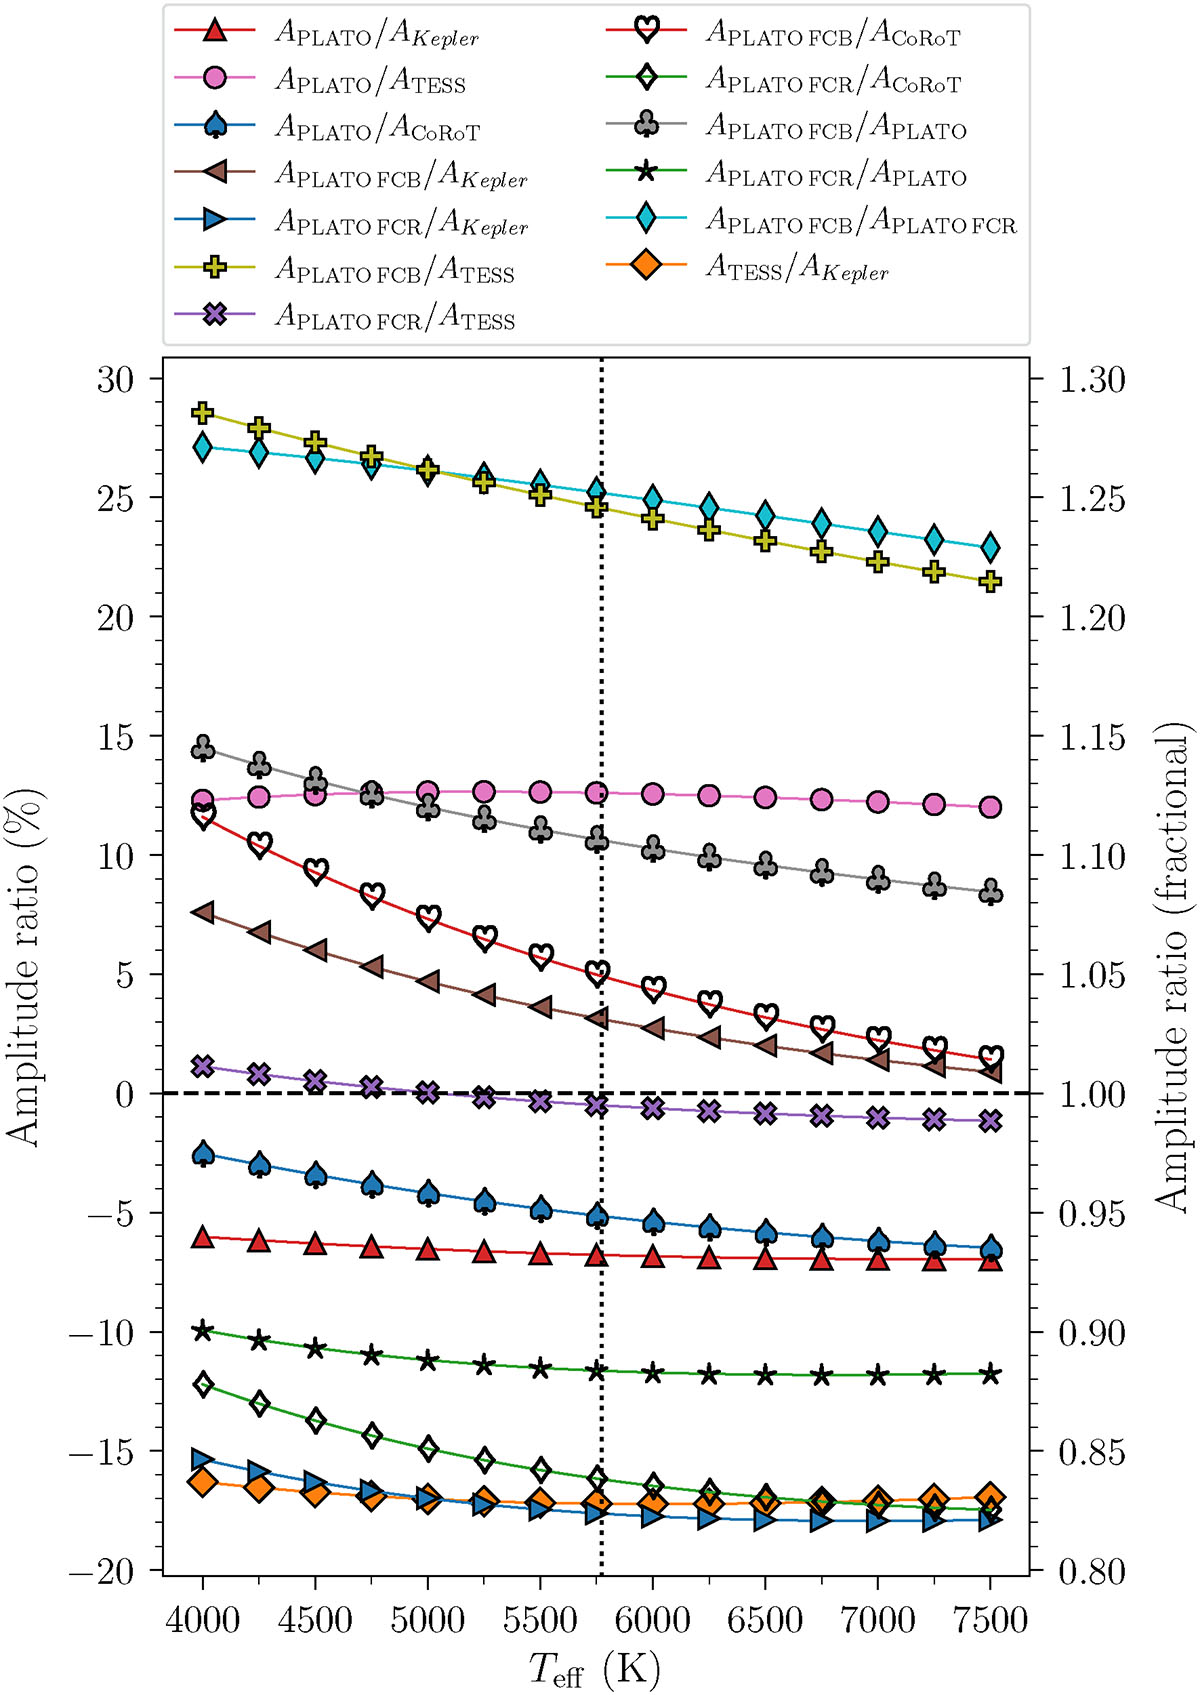
Fig. 4.
Download original image
Amplitude ratios between different missions, and/or the different filters of the PLATO mission, as a function of Teff (see legend). The amplitude change is shown as both a percentage deviation (left axis) and as a fractional ratio (right axis). The horizontal dashed line indicates equal amplitudes, while the vertical dotted lines indicate the solar Teff.
Current usage metrics show cumulative count of Article Views (full-text article views including HTML views, PDF and ePub downloads, according to the available data) and Abstracts Views on Vision4Press platform.
Data correspond to usage on the plateform after 2015. The current usage metrics is available 48-96 hours after online publication and is updated daily on week days.
Initial download of the metrics may take a while.