Open Access
Fig. C.2.
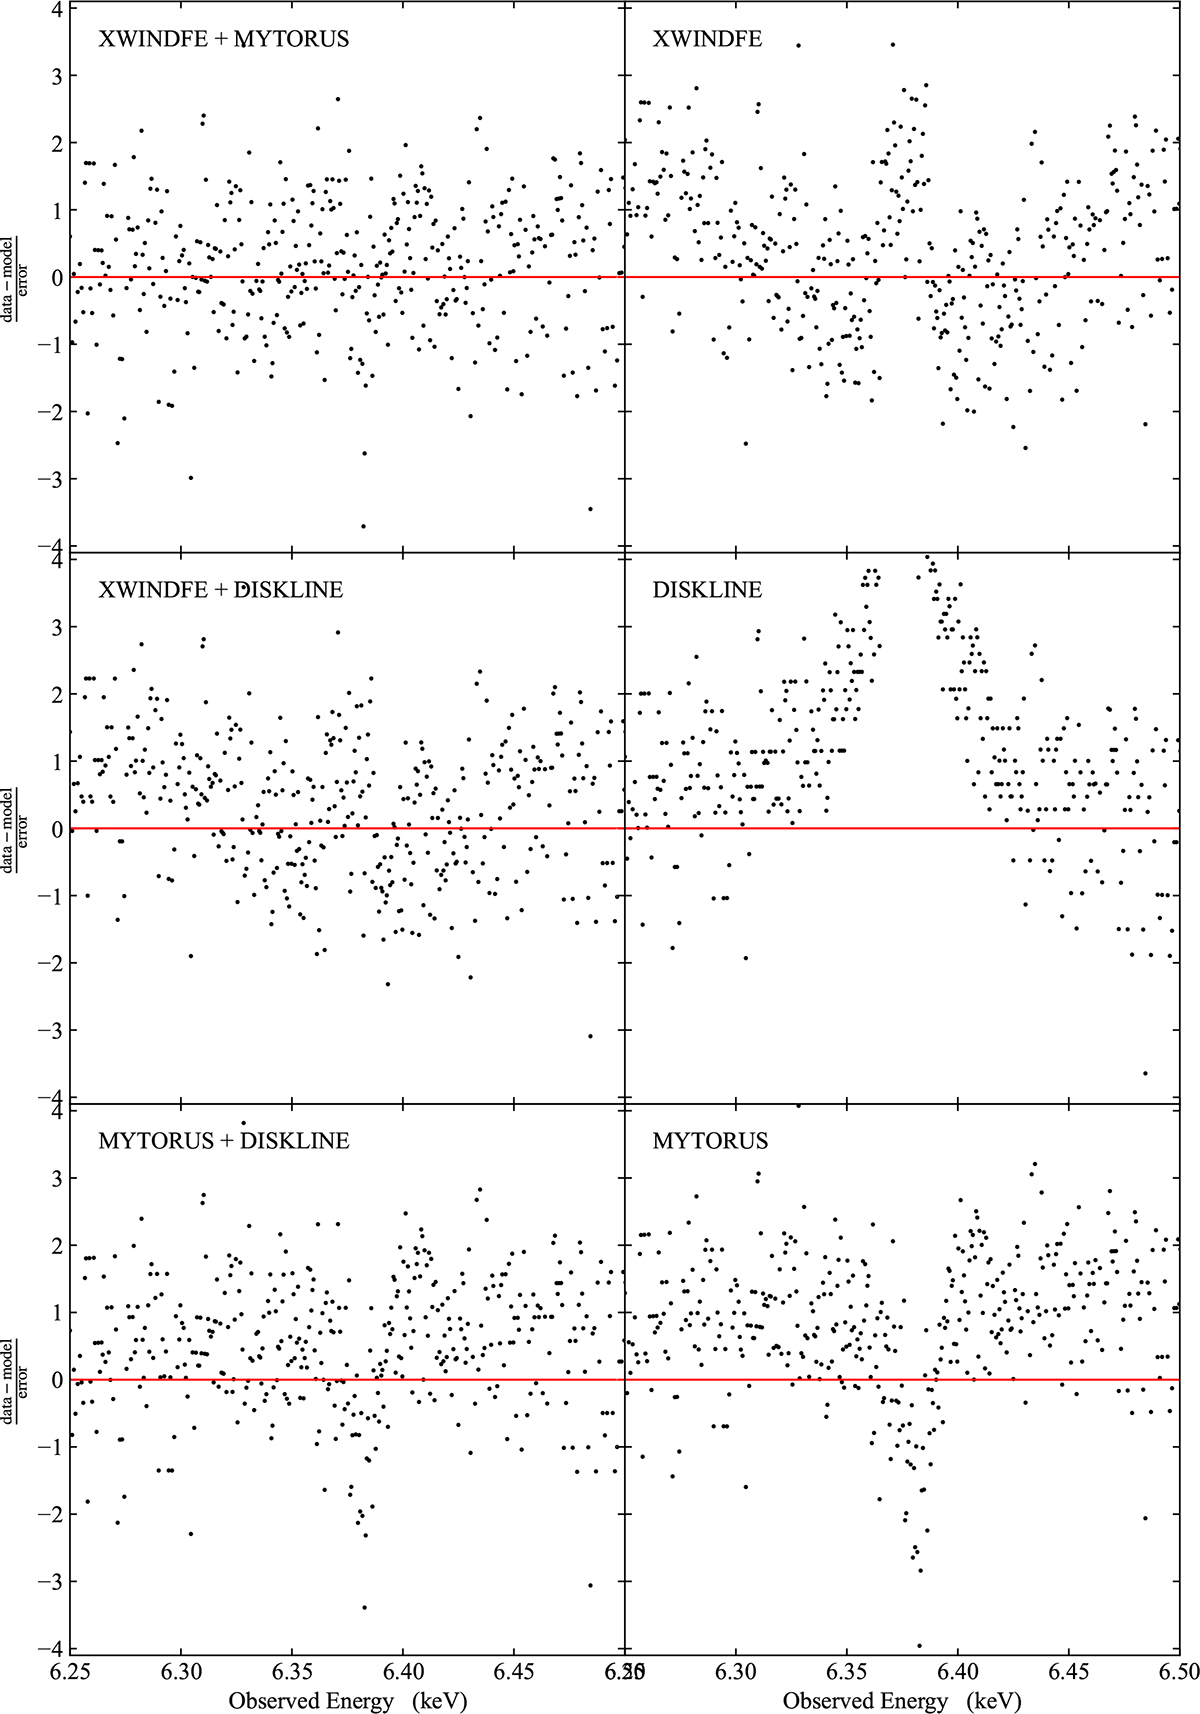
Download original image
Residual to the fits presented in Fig. C.1. Note we have chosen to zoom in on the 6.25-6.5 keV region in order to highlight the residuals around the Fe-Kα complex. The fits, however, are performed across the 5.0-6.6 keV range.
Current usage metrics show cumulative count of Article Views (full-text article views including HTML views, PDF and ePub downloads, according to the available data) and Abstracts Views on Vision4Press platform.
Data correspond to usage on the plateform after 2015. The current usage metrics is available 48-96 hours after online publication and is updated daily on week days.
Initial download of the metrics may take a while.