Fig. 2.
Download original image
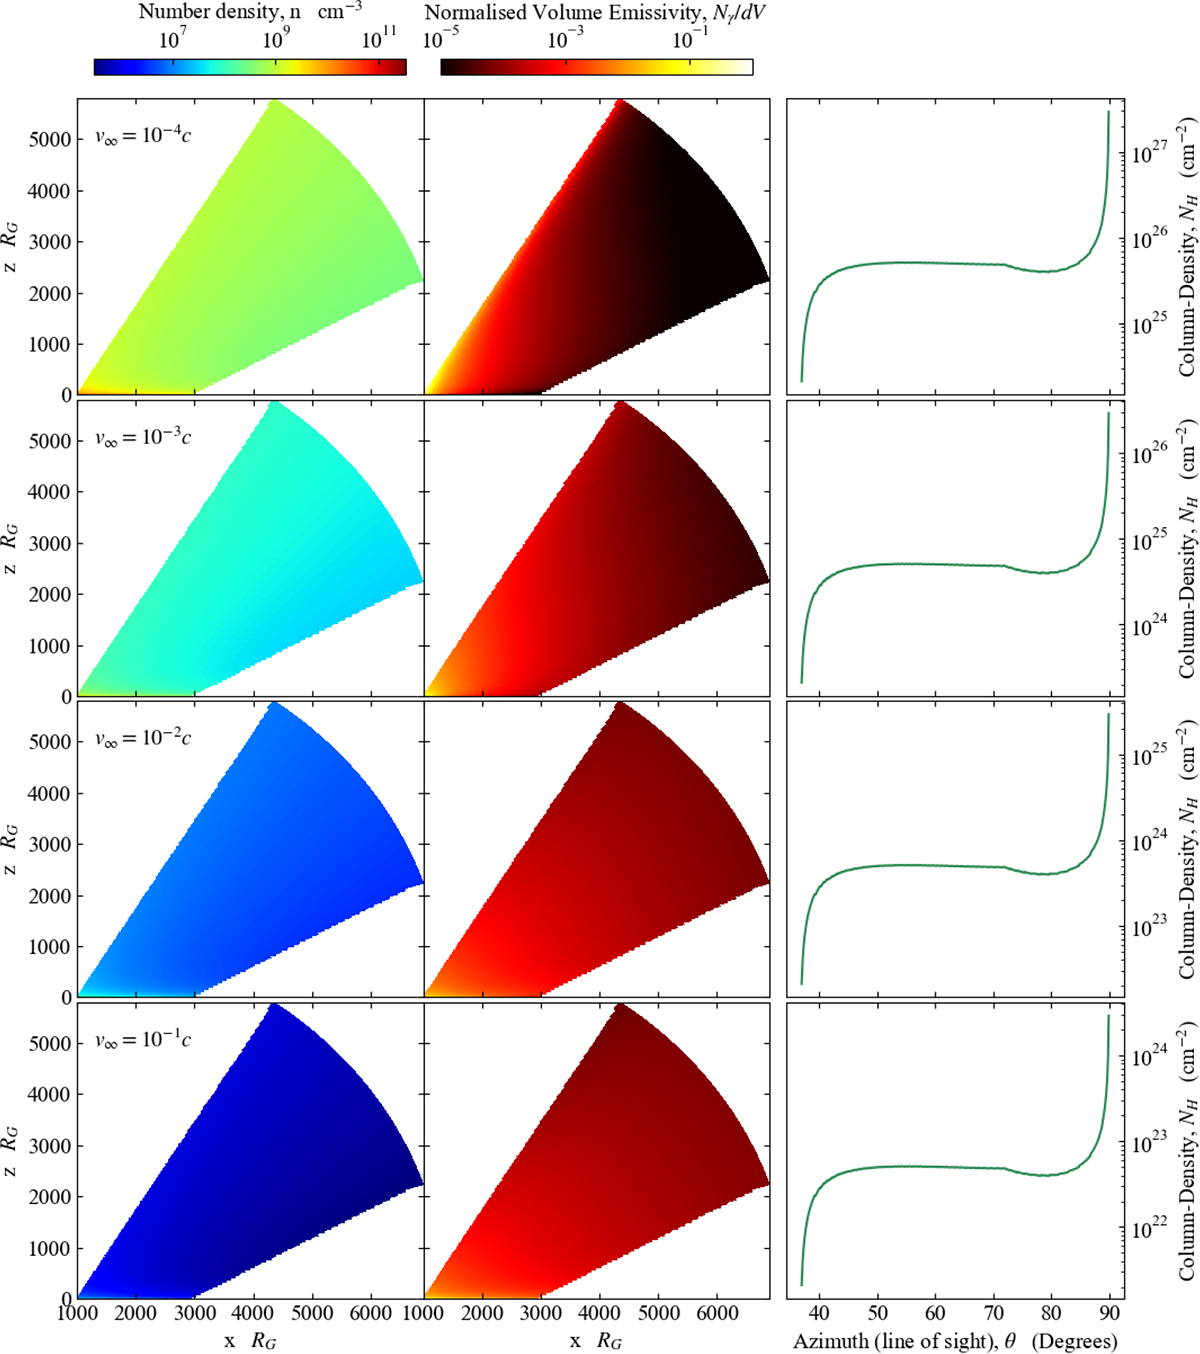
Wind density profile (left column) and corresponding emissivity profile (middle column) for a range of outflow velocities (increasing from top to bottom, value given in top left corner of each row). The right column shows the column-density profile for varying lines of sight through the winds. These have all been calculated for a wind launched between rin = 1000 and rout = 3000, with ![]() and fcov = 0.9. The mass outflow rate has been set to ṁ = 0.1, for a 108 M⊙ black hole (where the mass is required to obtain physical units). The velocity profile has been given a scale length of rv = 500 and exponent β = 1, and the initial density profile (at the base) has κ = −1, weighting the outflow towards smaller radii. As expected, when the outflow velocity increases, the overall density also reduces. In general, the emissivity is weighted more strongly towards the base of the wind, where the density is highest (hence stronger absorption and/or fluorescence). For low velocity (high density), the emission will be strongly weighted to the inner edge of the wind, as now the absorption is sufficiently strong that the internal wind regions do not see significant illumination. Our highest velocity examples are chosen for demonstrative purposes rather than an attempt at a realistic BLR wind.
and fcov = 0.9. The mass outflow rate has been set to ṁ = 0.1, for a 108 M⊙ black hole (where the mass is required to obtain physical units). The velocity profile has been given a scale length of rv = 500 and exponent β = 1, and the initial density profile (at the base) has κ = −1, weighting the outflow towards smaller radii. As expected, when the outflow velocity increases, the overall density also reduces. In general, the emissivity is weighted more strongly towards the base of the wind, where the density is highest (hence stronger absorption and/or fluorescence). For low velocity (high density), the emission will be strongly weighted to the inner edge of the wind, as now the absorption is sufficiently strong that the internal wind regions do not see significant illumination. Our highest velocity examples are chosen for demonstrative purposes rather than an attempt at a realistic BLR wind.
Current usage metrics show cumulative count of Article Views (full-text article views including HTML views, PDF and ePub downloads, according to the available data) and Abstracts Views on Vision4Press platform.
Data correspond to usage on the plateform after 2015. The current usage metrics is available 48-96 hours after online publication and is updated daily on week days.
Initial download of the metrics may take a while.