Fig. 3.
Download original image
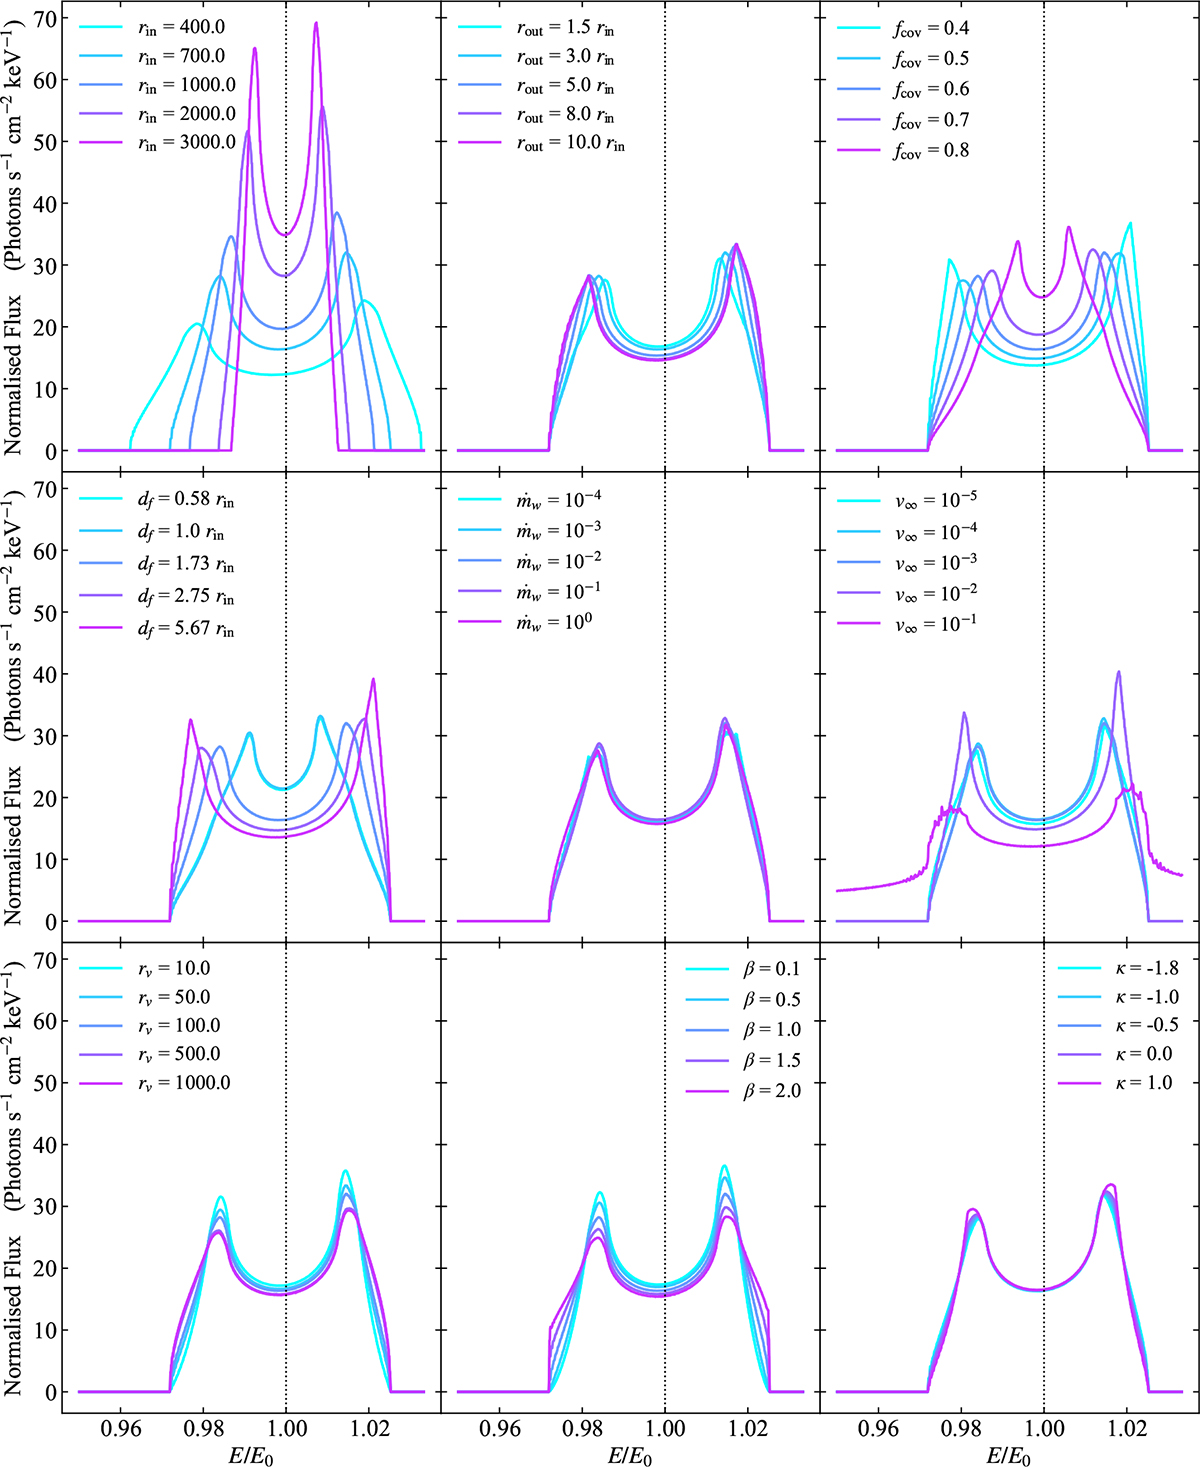
Example emission line profiles and their evolution with varying wind parameters. These have all been re-normalised to have the same total flux, and have all been calculated for an observed inclination of 45 degrees. Each panel shows the effect of varying an individual parameter, given in the top left corner of each panel. When not being varied, parameters are fixed at: ṁw= 10−2, rin = 700, rout = 3rin, ![]() , fcov = 0.6, v∞ = 10−3, rv = 100, β = 1, κ = −1. These are all viewed at an observer’s inclination of i = 45 degrees. The parameter choices for df are chosen such that they correspond to wind opening angles on the inner edge of αmin = 60° ,45° ,30° ,20° , and 10° (see Fig. 1 for a definition of the opening angle).
, fcov = 0.6, v∞ = 10−3, rv = 100, β = 1, κ = −1. These are all viewed at an observer’s inclination of i = 45 degrees. The parameter choices for df are chosen such that they correspond to wind opening angles on the inner edge of αmin = 60° ,45° ,30° ,20° , and 10° (see Fig. 1 for a definition of the opening angle).
Current usage metrics show cumulative count of Article Views (full-text article views including HTML views, PDF and ePub downloads, according to the available data) and Abstracts Views on Vision4Press platform.
Data correspond to usage on the plateform after 2015. The current usage metrics is available 48-96 hours after online publication and is updated daily on week days.
Initial download of the metrics may take a while.