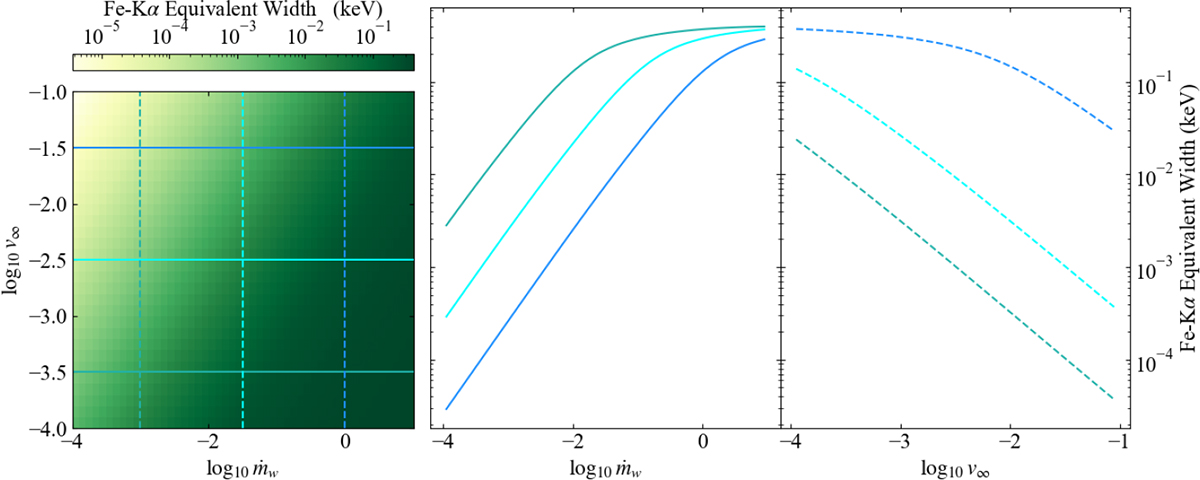
Fig. 4.
Download original image
Left: colour-plot showing the equivalent width of the Fe-Kα emission line for varying ṁw and v∞. The darker the shade of green, the larger the equivalent width. The vertical, horizontal solid, and dashed lines correspond to the slices used to extract the curves of growth on the right as a function of ṁw/v∞. Right: curves of growth as a function of ṁw (left panel) and v∞ (right panel). As ṁw increases, so does the equivalent width, until eventually the line saturates due to the wind becoming optically thick. Conversely, increasing v∞ will reduce the equivalent width, as this reduces the overall density of the wind (see Fig. 2) leading to a lower degree of absorption and thus fewer photons available to re-emit as Fe-Kα.
Current usage metrics show cumulative count of Article Views (full-text article views including HTML views, PDF and ePub downloads, according to the available data) and Abstracts Views on Vision4Press platform.
Data correspond to usage on the plateform after 2015. The current usage metrics is available 48-96 hours after online publication and is updated daily on week days.
Initial download of the metrics may take a while.